


Related

Portfolio Strategies
The amount saved, the allocation followed and the withdrawal rate chosen all determine how much retirement income a portfolio can safely provide.

This article deals with several important retirement questions: “How much money do I need in my investment portfolio at the start of retirement?” and “How much can I safely withdraw from my investment portfolio during the retirement years?”
While it’s not possible to provide a precise answer that applies to everyone’s unique situation, it is possible to provide general guidance.
Let’s start with the first question: “How much money do I need in my investment portfolio at the start of retirement?” This is one aspect of retirement portfolios that is surprisingly straightforward. The amount of your preretirement income that you will be able to replace while in retirement is directly (and mathematically) related to your retirement portfolio account balance, which I translate into a retirement account multiple, or RAM. The connecting tissue between these two variables is your initial withdrawal rate—or the percentage of your retirement account balance that you are withdrawing in the first year of your retirement.
As shown in Table 1, if your preretirement salary was $100,000 and you have accumulated a retirement account balance of $1.2 million, you have a RAM (retirement account multiple) of 12x ($1,200,000 ÷ $100,000). A 4% withdrawal rate in the first year of retirement equals $48,000 (retirement account balance $1.2 million × 0.04). This equals a 48% replacement of your preretirement income of $100,000 coming from your investment portfolio. Understandably, you may have other retirement income from other sources.
Various combinations of RAM and withdrawal rates are summarized in Table 2. For example, a RAM of 7x that is paired with a 3% initial withdrawal rate will allow you to receive (in the first year of retirement) 21% of your preretirement annual salary. Or, a RAM of 12x paired with a 4% initial withdrawal rate will allow you to replace 48% of your final working salary (highlighted in yellow in Table 2) in the first year of retirement. A RAM of 15x and 5% withdrawal rate equals 75% income replacement in retirement, and so on.
The figures in Table 2 represent the percentage of preretirement income being replaced in the first year of retirement. Numbers in red represent income replacement ratios of below 60%. The figures in green represent income replacement of 60% and higher. For many retirees, the replacement ratios in red may not provide adequate retirement income. Red numbers are caused by a RAM that is too low and/or a withdrawal rate that is too small.
At the moment of retirement, two issues are extremely relevant: your retirement portfolio account balance and the percentage of preretirement income that you are attempting to replace (in full or in part). Table 2 provides guidance regarding the relationship between those two variables. For example, if you are wanting to replace 100% of your final working salary, you will need a retirement account balance at least 15x larger than your final salary. However, you would need to withdraw 7% of your account balance during the first year to meet your income goal. A withdrawal rate of 7% is quite high. Alternatively, if you have a retirement account balance equal to 20x your final salary, you can drop down to a 5% withdrawal rate in your first year of retirement. The lower the withdrawal rate the better—in terms of not outliving your savings.
All the analysis presented so far only gets you through the first year of retirement. The next question—and it is a big one—pertains to how many years your portfolio will last. To help address that question, I have evaluated several different retirement portfolios over the past 89 years. Only four asset classes have performance data going back to 1926 (large-cap U.S. stocks, small-cap U.S. stocks, U.S. bonds, and U.S. cash).
The first portfolio (see Table 3) is a conservative retirement model that consists of 25% U.S. stocks and 75% fixed income (specifically, 15% large-cap U.S. stocks, 10% small-cap U.S. stocks for the stock portion and 55% bonds and 20% cash for the fixed-income portion). This four-asset portfolio was rebalanced at the end of each year back to the prescribed allocations. The performance of large-cap U.S. stocks was represented by the S&P 500 index, small-cap U.S. stocks by the Ibbotson Small Stock Index from 1926–1978 and the Russell 2000 index from 1979–2014, U.S. bonds by the Ibbotson U.S. Intermediate Government Bond Index from 1926–1975 and the Barclay’s Capital Aggregate Bond Index from 1976–2014, and U.S. cash was represented by 90-day Treasury bills.
Over the 89-year period from January 1, 1926, to December 31, 2014, there were 55 rolling 35-year periods. The 25/75 portfolio was tested under various initial withdrawal rates and cost-of-living adjustments (COLA) to determine how often it was able to last for at least 35 years (simulating the 35-year period between ages 65 and 100 for a retiree).
As shown in Table 3, the 25/75 portfolio had a success rate of 100% assuming a 2% initial withdrawal rate on a 0% cost-of-living adjustment (COLA). Historical “success rate” is defined as the retirement portfolio remaining solvent for at least 35 years. However, as illustrated in Table 2, a 2% initial withdrawal rate only provides an income replacement of 50% if a RAM of 25x is assumed, which is a very bold assumption of RAM. At a more likely RAM of 12x, the income replacement ratio associated with a 2% withdrawal rate is a modest 24% (as calculated by multiplying RAM by the withdrawal rate, or 12 × 0.02). In addition, a 0% COLA means the amount of money withdrawn each year never increased during the 35 years of retirement. Likely a poor assumption.
Under more reasonable assumptions of a 4% initial withdrawal rate and an annual COLA of 3% during the 35-year retirement period, the 25/75 portfolio had a success rate of 93% as shown by the yellow highlighting in Table 3. (If we assume a RAM of 12x, a 4% withdrawal rate allows a retiree to replace 48% of their pre-retirement income). As can be seen, the success rate of a 25/75 portfolio declines dramatically once the initial withdrawal rate reaches 5% or higher and if the COLA is 3% or higher. A success rate of below 90% may not be acceptable for a retiree. (Green percentages indicate success rates of 90% or higher, while red percentages indicate success rates of 89% and below). As stated, “success rate” refers to the ability of the retirement portfolio to last 35 years or longer over the past 89 years.
A word about the cost-of-living adjustment, or COLA. Assuming a starting retirement account balance (or RAM) of $1.2 million and an initial withdrawal rate of 4%, the first year’s withdrawal would be $48,000 (as shown in Table 1). If the selected COLA is 3%, the withdrawal made by the retiree in Year 2 would be $49,440: Year 1 withdrawal multiplied by one plus the COLA ($48,000 × 1.03). The next year the withdrawal would be $50,923, and so on each year with each withdrawal increasing by 3%.
The second retirement portfolio being evaluated is a moderate risk 65% stock/35% fixed income model (specifically 40% large-cap U.S. stocks and 25% small-cap U.S. stocks for the stock portion, and 25% bonds and 10% cash for the fixed-income portion). The success of a 65/35 model as a retirement portfolio was markedly higher than the 25/75 portfolio—particularly when an initial withdrawal rate of 4% or higher and a COLA above 3% were used.
As shown in Table 4, a 65/35 portfolio had a success rate of 98% assuming a 4% initial withdrawal rate and a 3% annual COLA (highlighted in yellow). In other words, a 65% stock/35% fixed income retirement portfolio survived at least 35 years in 54 of the 55 rolling 35-year periods between 1926 and 2014 when 4% initial withdrawal rate and a 3% COLA were used. Even at an initial withdrawal rate of 5% and a COLA of 3%, the 65/35 portfolio had a historical success rate of 91% compared to a success rate of 58% for the 25/75 portfolio.
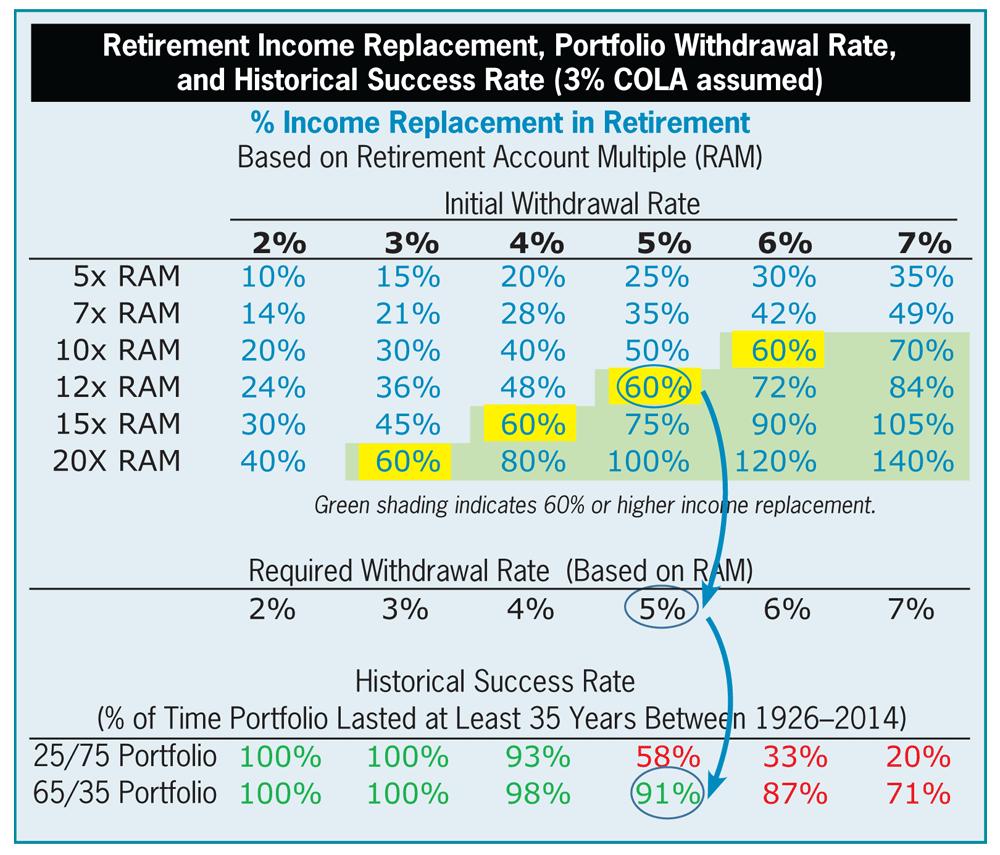
In an attempt to address the question of “how much can I safely withdraw each year from my retirement portfolio?,” the information in Table 2 will need to be connected with the information in Tables 3 and 4. This connection is provided in Table 5.
Let’s assume that a retiree is attempting to replace about 60% of their preretirement income from their retirement portfolio via annual withdrawals from their retirement portfolio, as highlighted in yellow in Table 5. (If the retiree’s ultimate goal is to replace 100% of their preretirement income, the remaining needed income replacement (40% in this case) will need to come from other retirement income sources such as Social Security, pension(s), rental income, etc.).
A 60% income replacement is not possible if the retiree’s RAM is 5x or 7x. If, however, the retiree has an account balance that is 10x larger than their preretirement income (a RAM of 10x), they can replace 60% of their preretirement income if they employ a 6% withdrawal rate (as calculated by RAM × withdrawal rate = % income replacement).
In Table 5, we see several combinations that can produce a 60% income replacement: a 10x RAM and a 6% withdrawal rate, a 12x RAM and a 5% withdrawal rate, a 15x RAM and a 4% withdrawal rate, and a 20x RAM with a 3% withdrawal rate (all highlighted in yellow).
If a 3% withdrawal rate is used, both portfolios had a historical success rate of 100%. If a 4% withdrawal rate is used, the 25/75 portfolio had success 93% of the time and the 65/35 portfolio 98% of the time. At a 5% withdrawal rate, the 25/75 portfolio lasted at least 35 years in only 58% of the historical 35-year periods, whereas the 65/35 portfolio had success 91% of the time. A 6% withdrawal rate led to a 33% success rate for the 25/75 portfolio and an 87% success rate for the 65/35 portfolio. The critical element in creating a durable retirement portfolio that has a high probability of lasting at least 35 years is an adequate starting balance (or RAM) and as low of a withdrawal rate as possible—plus a retirement account that generates the needed return (i.e., investment performance).
If Table 5 does not include your particular RAM, simply use the formula: RAM × withdrawal rate = % income replacement and then look up the historical success rate in Tables 3 or 4 [based on the withdrawal rate, COLA, and type of portfolio allocation (25/75 or 65/35) that you are assuming].
The green shaded boxes in Table 5 represent income replacement of 60% or higher. The key to using Table 5 is to identify your RAM and the percentage income replacement that it provides at various withdrawal rates.
Finally, check the historical success rate of the withdrawal rate you have selected. In Tables 3 and 4, success rates in green type indicate 90% or higher, while success rates in red type indicate historical success rates below 90%. Low success rates indicate you may need to consider a lower withdrawal rate (which will cause a lower income replacement).
The four-asset portfolio analyzed in this article represents the four asset classes that can be studied over the past 89 years. It represents a diversified portfolio that includes domestic large-cap stocks, small-cap stocks, bonds, and cash. Today, of course, we can build diversified retirement portfolios that include more than just stocks, bonds and cash.
Other important asset classes to consider include real estate, natural resources, non-U.S. stocks and emerging market stocks, non-U.S. bonds, and inflation-protected bonds. Fortunately, there are many mutual funds and exchange-traded funds (ETFs) that can be assembled to meet the needs of any retiree.
The core concepts outlined in this article should provide a useful template when building your retirement portfolio.
Portfolio Strategies

Portfolio Strategies

Financial Planning

Donald Myers from AZ posted over 10 years ago:
J H Frazier from CO posted over 10 years ago:
John Ostendorf from TX posted over 10 years ago:
Robert B. Thompson from MA posted over 10 years ago:
Jack from NC posted over 10 years ago:
Matt from CA posted over 10 years ago:
Steve from NJ posted over 10 years ago:
John from WI posted over 10 years ago:
Mike from WI posted over 10 years ago:
Hugh Blanchard from VA posted over 10 years ago:
Fred Schantz from VA posted over 10 years ago:
Fred Schantz from VA posted over 10 years ago:
Richard Cloutier from GA posted over 10 years ago:
Michael Alt from FL posted over 10 years ago:
Robert Dailey from CA posted over 10 years ago:
RLS from MA posted over 10 years ago:
Alfred Falcone from NY posted over 10 years ago:
Alfred Falcone from NY posted over 10 years ago:
Mike from VA posted over 8 years ago:
Robert Mitall from PA posted over 8 years ago:
Michael Redden from CT posted over 8 years ago:
LOUIS A from VA posted over 5 years ago:
You need to log in as a registered AAII user before commenting.
Log InCreate an account