

Related

Stock Strategies
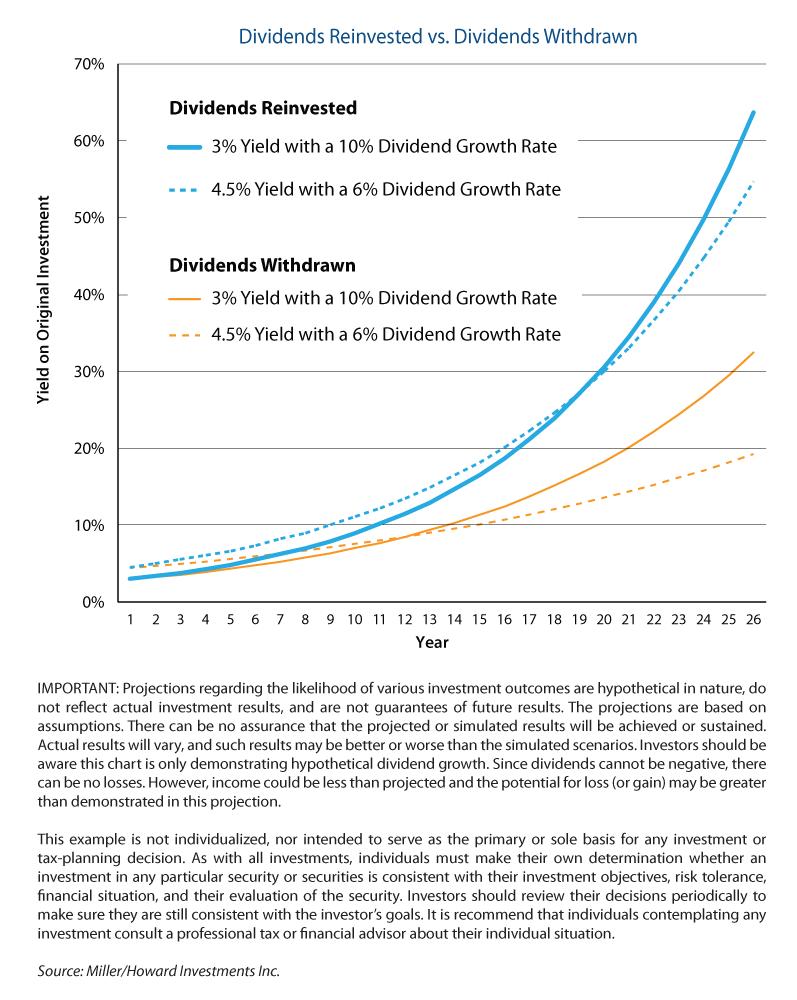
A high starting dividend, sustainable dividend growth and dividend reinvestment can result in a large yield on original investment (YOI).

We’re in a world of light-speed algorithms, rapid sector and industry-group rotations, jumpy traders literally selling chip stocks due to the price of tea in China, talking heads and savvy gurus confidently explaining where the markets are going (but not actually explaining why they’re not in the office working), and data washing over us in a giant never-ending waterfall.
But all the talk and all the strategies seem powerless and ephemeral compared with the fecund landscape we see when contemplating the more permanent topography composed of compounding dividends and dividend growth over time.
Dividends provide a segment of return that is always positive. Increases in dividends provide an increased positive cash return and, consequently, increase the value of the instrument producing that return. Positive fluctuations are normal in the world of cash payments to shareholders; negative fluctuations are a rarity.
The classic demonstration of the pure power of compounding is the story of Peter Minuit, the Dutch colonial governor of New Amsterdam, who craftily swindled the island of Manhattan from Lenape tribesmen for a grand sum of 60 guilders, equivalent to $24 in 1626. Minuit surely felt he made out well, even if he and his constituents couldn’t know that the acquired real estate would be worth in excess of $2 trillion in 2015.
If the Lenape merely took that $24 and invested it in a relatively defensive bond yielding 5%, and then diligently reinvested the proceeds over the ensuing 388 years, their $24 would be worth $4.2 billion today, an amount of principal that would provide their 2015 descendants with over $200 million of interest income per year. (Assuming, of course, that they could have averaged the 5% rate through the period.)
Not bad, but not $2 trillion. What if the Lenape had instead bought the 17th-century equivalent of a diversified portfolio of reliable companies yielding 4% with an expected annual dividend growth rate of 6%—about what a high-quality, high-dividend portfolio can deliver today? Even if the Lenape had never reinvested their yield and spent the income instead, the annual dividend income from their original shares alone, compounded 388 times at an annual growth rate of 6%, would be over $6 billion per year today! A nice retirement. But the math becomes even more charming if those annual dividends had been reinvested in more stock (which would pay more dividends used to buy more stock) each year. Under this scenario, by 2015 the original $24 Lenape investment would be yielding dividend income of $11 quadrillion, or eleven thousand trillion dollars, ($11,031,462,028,327,800) per year.
Most readers will likely not experience 400 years of compounding. But the principle is well illustrated. Over time, reinvesting income that increases can result in yield from income alone that’s far higher than anyone can reasonably expect from total return in the equity market.
The previous example is the essence of the concept of yield on original investment (YOI). YOI is simple; it’s the income yield you’d have today on an investment you made some time in the past. Harnessing this concept, an investor can achieve annual income returns of 10%, 20%, 30%, 50%, and more on original investment during an ordinary adult life. These are not “gains” in the usual sense. These are repeatable cash flows, each and every year. It’s not rocket science. Just two ingredients—sensible analysis and patience—are required. In other words, the best way to get a high yield on capital is to wait for it.
What’s the best way to harness this compounding? Lower yield and higher growth of yield? High yield with more modest growth of yield? Highest yield alone, forgetting about growth? What’s the optimal combination of yield and/or growth of yield in order to reach a given YOI goal, such as the retirement income return on a pool of capital invested today?
Until now, these seemingly simple questions haven’t been that easy for an adviser or investor to answer. There are two parts to any answer: What’s the math? And what will the world be like in 20 years, or 40 years?
For the first part, we’ve developed a future income-yield calculating tool, the Miller/Howard YOI Calculator, that we’re pleased to share with you on our firm’s website (www.mhinvest.com/yoi.html). The YOI Calculator will answer all these questions. For the second part, we say consider the YOI Calculator results in view of the uncertainties that the future always contains. (For example, in theory, highest growth of income will always eventually win the day. But for any given investment, how long can the assumed income growth rate last?)
The Miller/Howard YOI Calculator directly illustrates the results of dividend investing over time. We designed the tool with the hope that it would provide a basic roadmap to help investors who may have, for instance, a certain level of future dividend income from their investments in mind. Investors simply enter their beginning principal, beginning portfolio dividend yield, projected portfolio growth of dividends, and whether they plan to reinvest their income or not. The YOI Calculator then generates a timeline of expected future portfolio income based on these assumptions—an estimated future yield on original investment. Further, the income timeline can be compared to another investment with different yield and yield growth parameters.
Comparative results are often counterintuitive. Most investors, we suspect, would think that a starting yield of 3% growing at 10% per year will eventually provide a higher yield than a starting yield of (to use a familiar profile) 4.5% with income growth of 6%. After all, won’t that rabbit of faster growth outrun the tortoise of slower growth?
In fact, with dividends reinvested, the income YOI from the first example (3% growing at 10%) will not exceed the annual income from the slower grower until year 20 (as shown in Figure 1). With no reinvestment it will take 12 years for the rabbit to exceed the tortoise, in terms of yield on original investment.
This raises a few issues. First, investors should not underestimate the value of a high starting yield base in achieving a high future income YOI. Second, many would be right to question whether or not the rabbit can keep running at 10% for 20 years. Life is hard. Business is hard. Events intervene. The Law of Large Numbers casts a shadow, as the bigger a company gets, the more difficult it is to maintain a high growth rate that would fund a high rate of distribution increases. This is why we find the phrase “moderate sustainable growth” appealing. In constructing a pro forma plan, we’d like to know that the result is reasonably possible—not just that it glows in a reality that is not especially probable. Seasoned quality companies with a great business model and durable markets can keep the compounding going. Frisky newcomers or over-leveraged companies, not so much.
Even at year 15, the reinvested tortoise has an income yield on original investment of about 18%. Does one really want to chase riskier stocks in search of an even higher future positive cash flow from an investment made today?
Obviously, in the uncertain world of the future there’s many a slip between cup and lip. Extrinsic factors such as interest rates or plunging commodity prices can temporarily inhibit a company’s ability to grow its distributions. In order to approach the pro forma plan, an investor needs to avoid distribution decreases—and therefore focus on financial strength whenever possible.
But the YOI Calculator provides a kind of roadmap or theoretical approach. We find it interesting to play around with various combinations, testing our intuitions and gaining a sense of the scale of time required for income compounding to do its job. For yield-oriented investors, the first step would surely be to test nearly any combination of reinvested yield and growth against a fixed-income investment (no yield growth). It should provide a kind of antidote to the illusory sense of security that bonds may provide.
Also, bear in mind that our YOI Calculator is only dedicated to discerning income yield on original investment. The slopes are smooth because the income portion of return is always (or almost always) positive. We don’t deal here with total return, since Mr. Market is sometimes manic and sometimes depressive, and the overall pattern of ups and downs has significant impact on total return. We assume, fairly safely we think, that with long-term income growth the price of the instruments producing that income will respond in kind.
Investors with a YOI focus are happier than others.
They don’t have to worry over their monthly account values bouncing up and down. They need only monitor the income levels in their investment portfolios. And that number is always positive.
Income level may move more quickly or more slowly than expected, but it is always positive.
Here are some of the factors Lowell Miller’s firm looks at when selecting securities for the various income-producing portfolios.
Cash Flow Coverage
This metric measures how much cash the business generates relative to how much it pays in dividends.
Free Cash Flow
This shows how much cash flow is available after all fixed expenses have been met and how much is available for shareholders. Some examples of relatively fixed expenses are debt repayments, capital expenditure obligations and interest coverage.
Interest Coverage
Interest on debt has priority as a claim, as companies need to meet their interest obligation before they can pay dividends.
Payout Ratios
Confirms that earnings are sufficient to pay the dividends long-term by dividing dividends by earnings; lower numbers indicate better coverage.
Future Debt Obligations
Monitor debt and bank lines, and the specific covenants of those bank lines, as well as the debt maturities. Will debt or its covenants limit a company’s ability to pay dividends?
Volatility of Earnings/Macro Business Environment
Is the company in a cyclical or non-cyclical business? How consistent are earnings and how consistent have projections been in the past?
Philosophy of Management
Is there a possibility that management will want to use their excess cash for other purposes? Will it look to acquire weaker competitors? Will it use current market conditions to retire future obligations (debt maturing in a few years or convertible preferred shares, for example) at discount prices?
Other Incentives for a Dividend Cut
Are there incentives to cut the dividend, such as new or temporary tax rulings, other government mandates (TARP, for example), competitive hoarding of cash in the company’s industry, repurchase of debt at a discount, etc.?
These are just some of the factors at play in Miller/Howard’s evaluation of a company’s ability to maintain its dividend payments. A company’s ability to maintain and grow its dividend payments during tough economic times is a strong signal of its financial health and competitive position.
Stock Strategies

AAII How-To


Kenneth Nisbet from CA posted over 11 years ago:
jeff watts from ca posted over 11 years ago:
frank mccraw from va posted over 11 years ago:
Michael Daillak from CA posted over 11 years ago:
R Shafron from FL posted over 11 years ago:
Daniel Madigan from CA posted over 11 years ago:
kevin n.murray from penna. posted over 11 years ago:
M Silverman from NY posted over 11 years ago:
Michael Mcneely from Az posted over 11 years ago:
Jerome Kamora from PA posted over 11 years ago:
Jack Heninger from CA posted over 11 years ago:
Marty Prager from CA posted over 11 years ago:
Steve from IN posted over 7 years ago:
You need to log in as a registered AAII user before commenting.
Log InCreate an account