

Related

Stock Strategies
by John Bajkowski | April 2004

“A bird in the hand is worth two in the bush.”
It’s an old saying, but it’s a sentiment felt by many conservative stock investors who prefer the stocks of stable and established companies that provide part of their return sooner, in the form of dividends, rather than later, in the form of capital gains. The recent change in the tax code reducing the taxable impact of common stock dividends for individual investors has boosted the desirability of dividend income, and many companies have responded with higher dividend payouts.
How does one choose among these kinds of stocks? One approach is followed by Geraldine Weiss, editor of the highly regarded Investment Quality Trends, a La Jolla, California-based newsletter that tracks and recommends stocks based on her approach.
Weiss melds a conservative, blue-chip investment style with a value approach, using dividend yield as a guide to value. A high dividend yield signals out-of-favor stocks, but many such stocks are out-of-favor for good reason—they are financially troubled. Weiss’ strategy attempts to weed out truly financially troubled firms by seeking out-of-favor stocks within a relatively safe sector of high-quality stocks.
Weiss outlined her approach in two books, “Dividends Don’t Lie,” with Janet Lowe (Longman Publishing, 1988, out of print), and her more recent “The Dividend Connection,” written with son Gregory Weiss (Dearborn Financial Publishing, 1995, out of print).
A screen adapted from Weiss’ methodology is built into Stock Investor Pro, AAII’s fundamental stock screening program and research database. Weiss examines over 25 years of data in her analysis, but Stock Investor Pro only covers seven years; therefore, a number of adjustments were made to the original Weiss methodology. But the underlying focus is identifying sound companies trading at reasonable dividend yield valuation levels. The screening criteria used in the program are detailed at the end of the article.
|
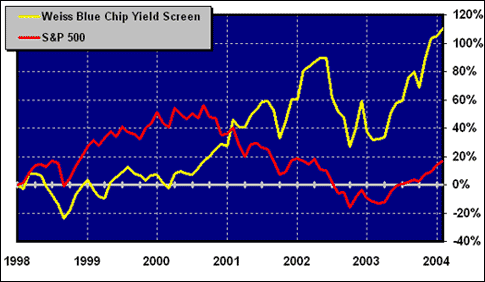
The stocks passing the Weiss screen have outperformed the S&P indexes each of the last four years after two initial years of underperformance (Figure 1). The performance reflects the swing of investor preference from large-cap growth stocks to attractively priced value stocks.
The characteristics of the stocks passing the screen are presented in Table 1. Even with greater recent emphasis on dividends, only 40% of the exchange-listed companies in Stock Investor Pro pay any dividends. The Weiss dividend screen looks for companies whose current dividend yield is near the average high dividend level observed over the last seven years. The median dividend yield for the stocks passing the screen on March 12, 2004, was 0.9%. Intel Corp. has the lowest current yield among the passing companies with its 0.6% yield, well above its seven-year average high yield figure of 0.4% (Table 2).
| TABLE 1. Weiss Screen Portfolio Characteristics | ||
| Portfolio Characteristics (Median) |
Weiss
Screen |
Exchange-
Listed Stocks |
| Dividend yield |
0.90%
|
0.00%
|
| Price-earnings ratio |
22.5
|
21.1
|
| Price-to-book-value ratio |
3.1
|
2.2
|
| EPS growth rate (hist 5yr) |
8.80%
|
4.90%
|
| EPS growth rate (est 3-5yr) |
12.60%
|
14.00%
|
| Market cap (million) |
$3,390
|
$358
|
| Relative strength vs. S&P |
10.00%
|
18.00%
|
| Data as of March 12, 2004. | ||
| Monthly Observations | ||
| Average no. of passing stocks |
10
|
|
| Highest no. of passing stocks |
25
|
|
| Lowest no. of passing stocks |
0
|
|
| Monthly turnover |
28.70%
|
|
Looking at other valuation measures, the group of passing companies is priced more richly than the typical exchange-listed stock. The median price-earnings ratio is 22.5 for the Weiss passing companies compared to the 21.1 median for exchange-listed stocks. The price-to-book-value ratio is also higher for stocks passing the Weiss screen, 3.1 versus 2.2.
Earnings and cash flow growth help to fuel dividend growth. The stocks passing the Weiss screen have exhibited a higher growth in historical earnings, 8.8% versus 4.9%; however, looking forward the market has slightly lower earnings growth expectations for the stocks currently passing the Weiss screen, 12.6% compared to 14.0% for exchange-listed stocks.
Intel’s seven-year earnings per share growth rate of 1.4% is the lowest of the passing stocks. However, its seven-year annual dividend growth rate of 21.9% is above average for this group. Intel has raised its dividend four times over the last seven years including a doubling of the payout this coming quarter.
The debt-to-equity ratio shown in Table 2 looks at the financial strength and leverage of a company, while the payout ratio reports how much of earnings are being paid out in the form of dividends. Both measures are used in the Weiss screen to help ensure minimum levels of financial strength and safety of dividend payments.
| TABLE 2. Stocks That Passed the Weiss Screen | |||||||||
| Company (Exch: Ticker) |
Div Yield
|
No of
Div Incr in Last 7 Yrs |
7 Yr Ann’l Grth
|
EPS
Grth Est (%) |
Debt-
Equity Ratio (%) |
Payout
Ratio (12 Mo) (%) |
Description | ||
|
Cur-
rent (%) |
High
Avg 7Yr (%) |
||||||||
|
Div
(%) |
EPS
(%) |
||||||||
| Florida Rock Indus (N: FRK) | 1.6 | 1.4 | 5 | 13.7 | 15.6 | 12.5 | 15.7 | 20.6 | ready-mix concrete |
| Watsco, Inc. (N: WSO) | 1.4 | 1 | 3 | 8.6 | 11 | 10 | 16.7 | 11.4 | heat & cool equip |
| Arrow Int’l (M: ARRO) | 130.00% | 90.00% | 6 | 14 | 5.7 | na | 0.5 | 21.4 | disposable catheters |
| Becton, Dickinson & Co. (N: BDX) | 130.00% | 140.00% | 6 | 8.2 | 10.7 | 12.2 | 38.7 | 20.4 | medical supplies & dev |
| Illinois Tool Works (N: ITW) | $1 | $1 | 6 | 11.1 | 7.8 | 12.7 | 11.7 | 28.1 | engineered prods & sys |
| Ethan Allen Interiors (N: ETH) | 90.00% | 70.00% | 5 | 35.4 | 17.2 | 12.2 | 0.8 | 16.3 | home furnishings |
| Linear Technology (M: LLTC) | 0.8 | 0.6 | 6 | 26.7 | 7.8 | 22.2 | 0 | 26.7 | integrated circuits |
| Movado Group, Inc. (N: MOV) | 0.8 | 0.8 | 4 | 13.3 | 10.1 | 12.3 | 11.8 | 6.5 | brand-name watches |
| Cintas Corp. (M: CTAS) | 0.7 | 0.7 | 6 | 19 | 13.5 | 14.9 | 27 | 17.9 | corporate uniforms |
| Fastenal Co. (M: FAST) | 0.7 | 0.2 | 4 | 54.5 | 14.5 | 21 | 0 | 18.9 | sells industrial supplies |
| Intel Corp. (M: INTC) | 0.6 | 0.4 | 4 | 21.9 | 1.4 | 16.9 | 2.5 | 9.3 | semiconductor chips |
|
Source: AAII’s Stock Investor Pro/Reuters and I/B/E/S. Data as of March 12, 2004. |
|||||||||
Intel’s low debt-to-equity ratio of 2.5% indicates that very little long-term debt is issued by the company, while its payout ratio of 9.3% indicates the majority of earnings are retained for use by the company.
The median market cap of $3,390 million for the stocks passing the Weiss screen is consistent with a portfolio of mid- to large-sized companies. In comparison, the median market cap of exchange-listed stocks is $358 million.
The relative strength of stocks passing the Weiss screen indicates that they have outperformed the S&P 500 by 10% over the last year—good performance, but not as good as the 18% for the typical exchange-listed stock.
On average, 10 companies have passed the Weiss screen over the last six years, but during extreme market conditions we have observed as many as 25 stocks passing and one month in which no stocks passed.
Weiss maintains that all stocks go through cycles of undervaluation and overvaluation. She feels that investors can take advantage of these cycles—buying stocks when they are undervalued and subsequently selling them when they are overvalued—by comparing current dividend yields to historical norms for blue-chip companies. In Weiss’ view, dividends offer the best indication of both quality and value, while providing a steady source of return.
| What It Takes: Stock Investor Pro Weiss Screening Criteria |
|
Stock Strategies

Stock Strategies
AAII Stock Ideas

No comments have been added yet. Add your thoughts to the discussion!
You need to log in as a registered AAII user before commenting.
Log InCreate an account