


Wayne Thorp leads a class in AAII's new Essential Investing Video Course. Go to https://www.aaii.com/ves for more information and to subscribe.


In the June installment of Technically Speaking we highlighted equivolume charts, which integrate volume with price plots to help investors and traders more easily verify the trading volume for price top and bottoms, support and resistance, and more.
This month, we focus on a unique chart overlay that applies the standard volume histogram found at the bottom of many price charts to price instead of time. Volume-by-price is an indicator that shows the amount of volume for a particular range of closing prices. This, in turn, enables you to determine the level of buying and selling interest at a given price level.
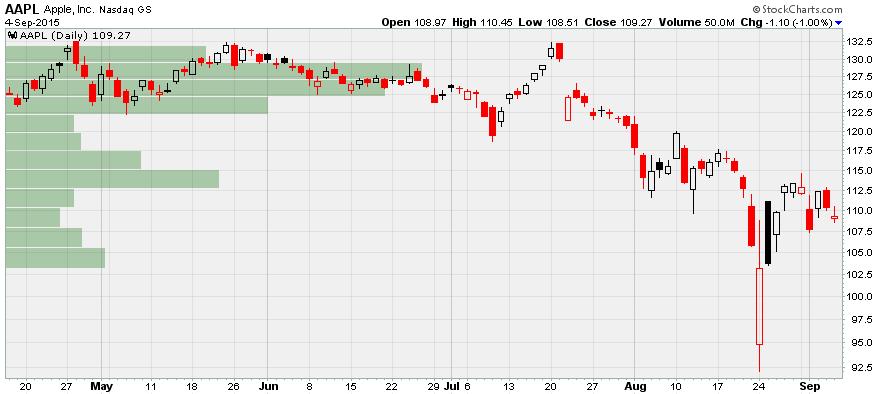
Figure 1 shows an example of volume-by-price for Apple Inc. (AAPL) for the 100 trading days ending on September 4, 2015. The volume-by-price bars are horizontal and appear on the left side of the chart to correspond with the price ranges. The chart in Figure 1 is from StockCharts.com, but you can also find the indicator with advanced and interactive charts at BigCharts.com. By combining volume and closing prices, this indicator can be used to identify high-volume price ranges to mark levels of support and resistance.
Calculation
There are four steps when calculating the volume-by-price bars:
- Find the high-low range for closing prices for the entire period being charted.
- Divide this range by 12 to create 12 equal price zones (the default number of zones).
- Total the amount of volume traded within each price zone.
- Divide the volume traded within each price zone into up volume and down volume (optional).
Volume-by-price typically uses 12 price zones as the default number. However, you can adjust this number. If you want a more granular analysis of the volume at certain price levels, increase the number of zones. In contrast, lowering the number of zones would increase the breadth of the price ranges used in the volume analysis.
Volume-by-price calculations are based on the entire period on the chart. So, volume-by-price on a six-month daily chart is based on all six months of daily closing data. Volume-by-price calculations do not extend beyond the historical data shown on the chart.
Table 1. Volume-by-Price Calculation Example for Apple (AAPL)
| Date | Close | Volume | Total Volume-by-Price | Positive or (Negative) Volume | Negative Volume-by-Price | Positive Volume-by-Price |
|
8/24/2015
|
103.12
|
162,206,288
|
Zone 1
|
(162,206,288)
|
|
|
|
8/25/2015
|
103.74
|
103,601,600
|
265,807,888
|
103,601,600
|
(162,206,288)
|
103,601,600
|
|
8/21/2015
|
105.76
|
128,275,472
|
Zone 2
|
(128,275,472)
|
|
|
|
9/1/2015
|
107.72
|
76,845,856
|
205,121,328
|
(76,845,856)
|
(205,121,328)
|
0
|
|
9/4/2015
|
109.27
|
49,996,312
|
Zone 3
|
(49,996,312)
|
|
|
|
8/26/2015
|
109.69
|
96,774,608
|
146,770,920
|
96,774,608
|
(49,996,312)
|
96,774,608
|
|
9/3/2015
|
110.37
|
53,233,940
|
Zone 4
|
(53,233,940)
|
|
|
|
9/2/2015
|
112.34
|
61,888,812
|
|
61,888,812
|
|
|
|
8/20/2015
|
112.65
|
68,501,624
|
183,624,376
|
(68,501,624)
|
(121,735,564)
|
61,888,812
|
|
8/31/2015
|
112.76
|
56,229,272
|
Zone 5
|
(56,229,272)
|
|
|
|
8/27/2015
|
112.92
|
84,616,056
|
|
84,616,056
|
|
|
|
8/28/2015
|
113.29
|
53,164,408
|
|
53,164,408
|
|
|
|
8/11/2015
|
113.49
|
97,082,816
|
|
(97,082,816)
|
|
|
|
8/4/2015
|
114.12
|
124,700,528
|
|
(124,700,528)
|
|
|
|
8/5/2015
|
114.88
|
99,762,144
|
|
99,762,144
|
|
|
|
8/19/2015
|
115.01
|
48,286,512
|
563,841,736
|
(48,286,512)
|
(326,299,128)
|
237,542,608
|
Table 1 is a portion of the volume-by-price calculation taken for Apple covering the 100 trading days illustrated in Figure 1. The data for those 100 days are sorted in ascending order (low to high) by the daily closing price. Over that period, the closing price for AAPL shares ranged from a low of $103.12 on August 24 to a high of $131.94 on May 22, for a range of $28.82 ($131.94 – $103.12).
Dividing the closing price range over those 100 days by 12 gives us the price zones that are represented by the horizontal bars on the left side of the chart in Figure 1: $28.82 ÷ 12 = 2.4017. So starting from 103.12, the 12 horizontal price zones in Figure 1 represent a range of 2.4017.
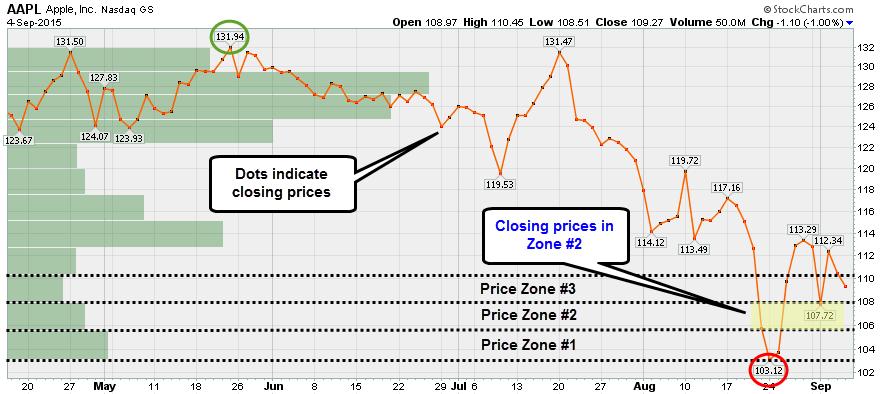
Figure 2 is the same chart from Figure 1, but with only the closing prices instead of the open-high-low-close bars. Starting from the low of $103.12, the chart added the zone size of 2.4017 to create the 12 price zones up to the high of $131.94. The chart highlights the first three price zones: $103.12 to $105.52, $105.53 to $107.92 and $107.93 to $110.33. Only the prices that fall within these zones are then used for that particular price-by-volume calculation.
As we have mentioned before, the price zone bars of the volume-by-price indicator represent the total trading volume for each individual price zone. Depending on the charting service you are using to plot volume-by-price, you may have the ability to separate the volume into positive and negative volume. Positive volume is trading volume for a period where the closing price is higher than the previous period, whereas negative volume comes about from a period in which the closing price is lower than the previous period’s closing price. The amount of positive and negative trading volume for a given price zone can help you determine whether support (positive volume) or resistance (negative volume) is present.
In Table 1 we calculated the total volume for each zone and broke out the positive and negative volume for each zone.
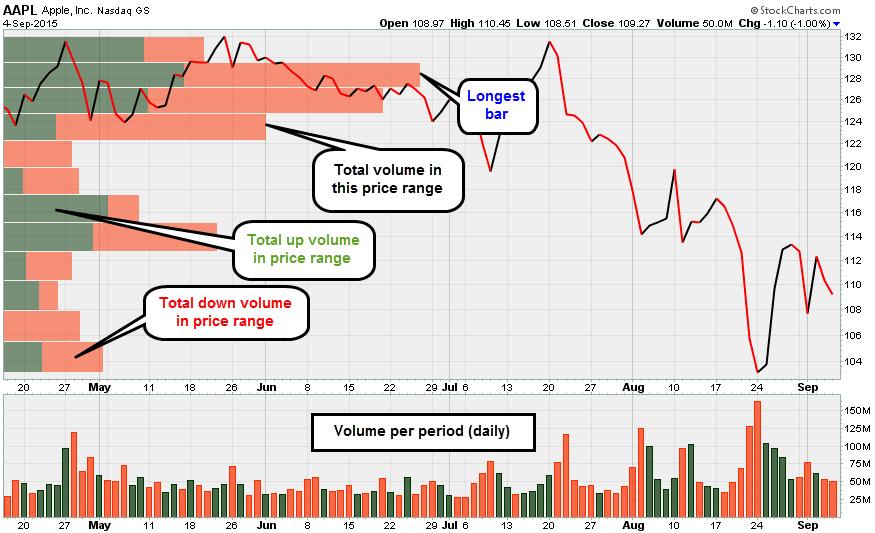
In Figure 3 we labeled several of the price zone bars. The second zone from the top has the longest bar, which indicates that zone had the highest trading volume among the 12 zones on the chart. This zone covers the price range from $127.14 to $129.54. Twenty-three closing prices comprise this zone and just under 1.1 billion shares of Apple were traded on those 23 days. The green portion of each price zone bar is that portion of the zone’s total trading volume that is up volume, while the red portion of the bar represents the down volume.
Interpreting Volume-by-Price
Volume-by-price is primarily used to gauge future potential support and resistance levels. Price zones with relatively high trading volume reflect higher interest levels that can influence future supply (resistance) or demand (support).
A support level is a price level that a stock has difficulty falling below. There is enough interest among investors at that price level to keep the price from falling further. Similarly, resistance is a price level that the stock has difficulty rising above. This is a level where buyers consistently take profits, preventing the price from moving higher.
The horizontal length (width) of a price zone bar indicates the volume strength at the given price range. Long price-by-volume bars below current price levels could represent potential support during a pullback. In contrast, long price-by-volume bars above current price levels may mark potential resistance during a recovery.
In addition, price breaks above or below long price-by-volume bars can be used as signals. A break above a long bar shows strength, as demand was strong enough to overcome excess supply. Similarly, a break below a long bar shows weakness, since supply was able to overwhelm demand.
It is worth mentioning, however, that we should not use price-by-volume bars to validate or confirm past support or resistance levels. In other words, if you are looking at a daily chart from July to December, the price-by-volume bars are based on all the price and volume data over that six-month period. We cannot use this data to confirm a resistance level that may have appeared in October because the indicator data extends beyond October with the chart ending in December. Again, volume-by-price is intended to be forward-looking and not as a means of confirming past support or resistance levels.
Support Levels
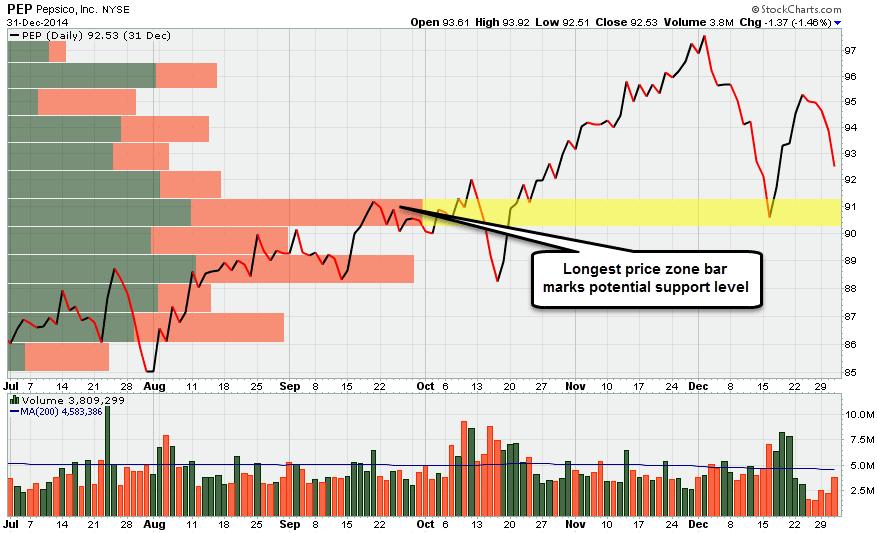
Figure 4a shows volume-by-price identifying support for PepsiCo Inc. (PEP) around $90-$91 at the end of 2014. This is the longest price zone bar on the chart. PEP shares have started to pull back from their early-December high and the mid-month rebound is also losing steam.
 (PEP) Identified" border="0" src="https://www.aaii.com/files/images/articles/9574-figure-4a.jpg" width="250" />
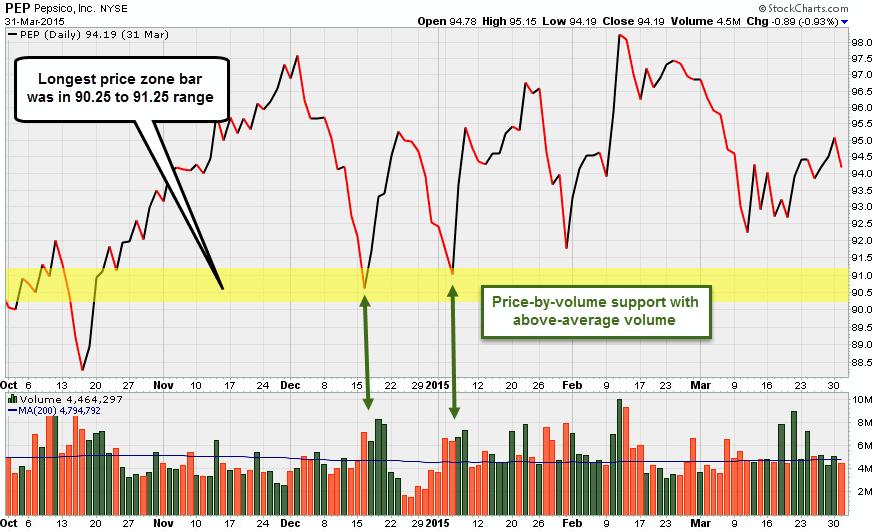
Figure 4b again shows PEP with the volume-by-price support range from Figure 4a highlighted in yellow. Based on this, we were expecting support in the $90-$91 range and the stock reversed here in early January on an uptick in trading volume.
Resistance Levels
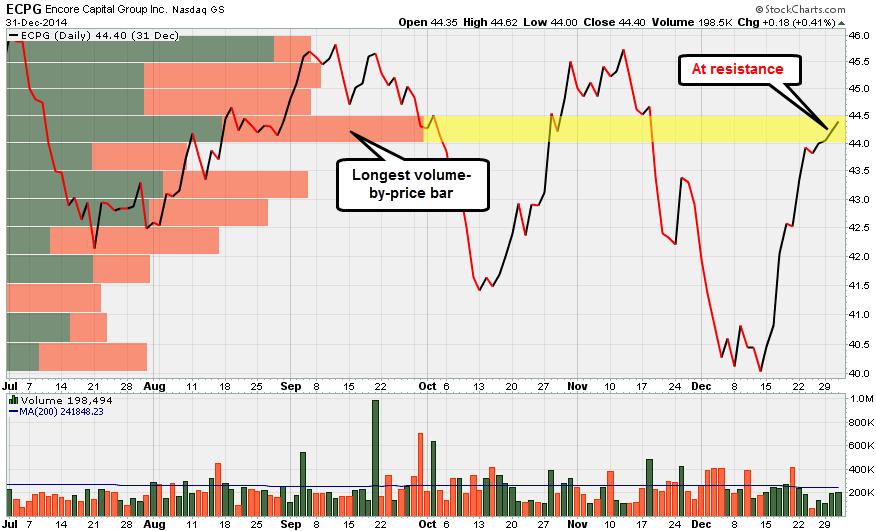
Shifting our attention to resistance levels, Figure 5a shows possible volume-by-price resistance for Encore Capital Group (ECPG) around $44.00-$44.50 at the end of 2014. The breaks above the resistance level in September and October-November are not really breakouts because the current volume-by-price calculation for this chart extends from the end of June through the end of December. The resistance level is represented by the longest price zone bar. At the end of December, ECPG shares were testing this resistance level after a sharp rebound from its early-December lows.
 (ECPG) Identified" border="0" src="https://www.aaii.com/files/images/articles/9574-figure-5a.jpg" width="250" />
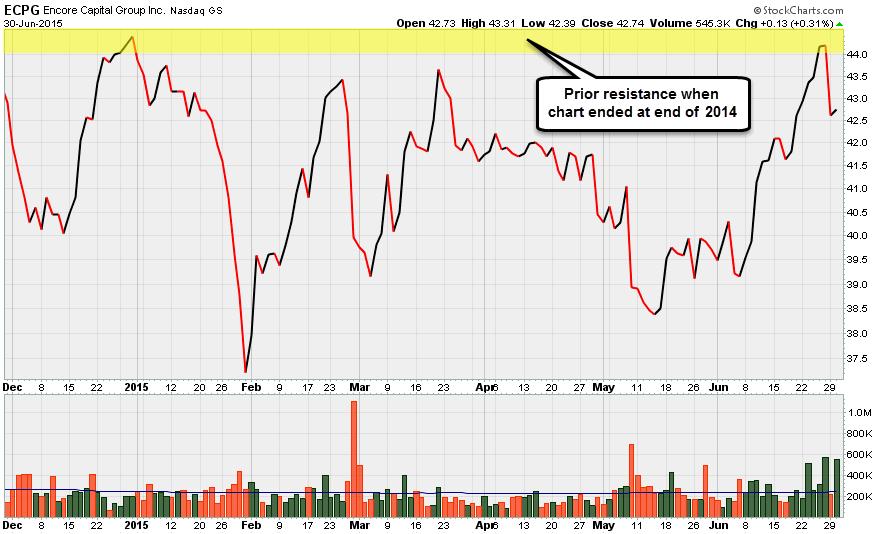
However, Figure 5b shows that Encore failed to break through this resistance level and its shares once again fell back from this level.
Support Breakdowns
Our previous examples showed where support and resistance levels, as indicated by volume-by-price zones, have held. However, this is not always the case. When prices break below a long volume-by-price bar, this may be a signal of increasing supply or selling pressure that could push prices lower. As stated, long bars below current prices show areas of potential support. A break below such support zones signal an increase in selling pressure, which may lead to lower prices.
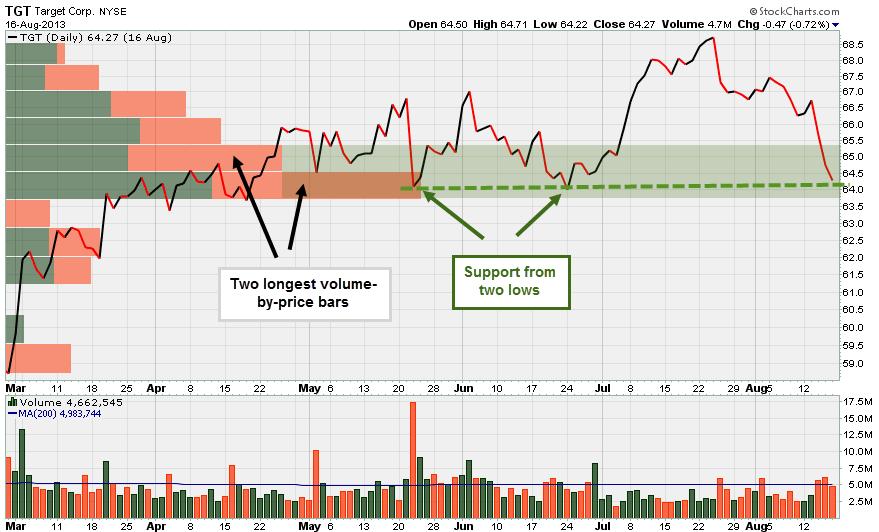
Figure 6a for Target Corp. (TGT) shows the two longest volume-by-price bars offering potential support around $63 to $65 in August 2013. In conjunction with this support zone, TGT shares had also formed multiple reaction lows around $64 in May and June. The support level is indicated by the green band on the chart.
 (TGT) Potential Support Levels" border="0" src="https://www.aaii.com/files/images/articles/9574-figure-6a.jpg" width="250" />
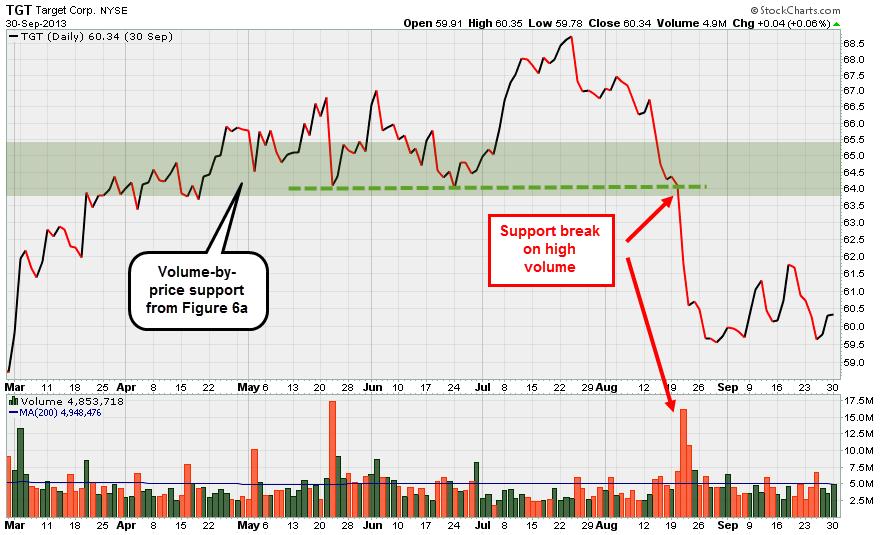
The breakdown in this support zone is illustrated in Figure 6b. The breakdown begins when prices violate the support line formed by the reaction lows and then build momentum to the downside as they fall below the volume-by-price support. Trading volume spikes, supply overwhelms demand and prices move decisively lower.
Resistance Breakthroughs
Lastly, a break above a long volume-by-price bar signals an increase in demand, which could indicate higher prices in the future. Long volume-by-price bars above current prices are areas where supply is sufficient enough that demand cannot overcome it. A break above this resistance zone marks rising demand and the possibility of higher prices.
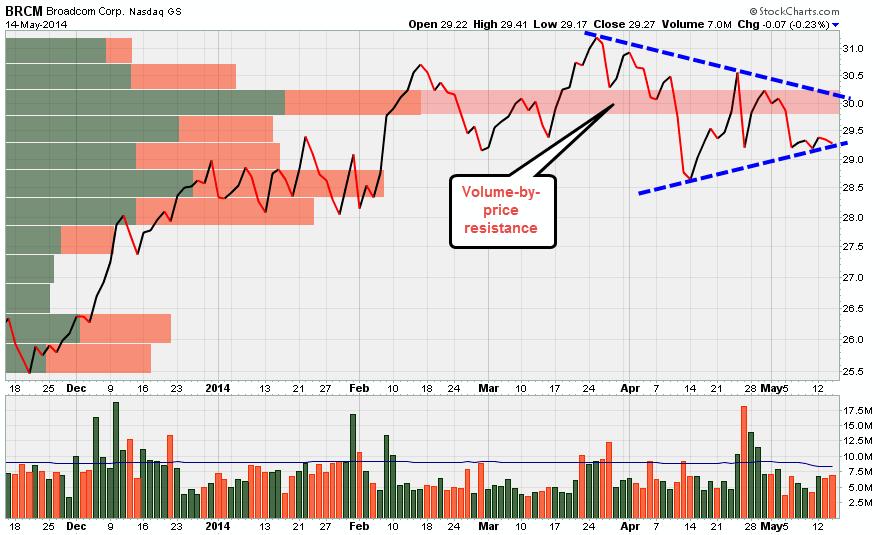
Figure 7a shows a long bar for Broadcom Corp. (BRCM), which shows excess supply in the $29.75 to $30.25 range. In addition, BRCM shares had run into resistance around $31 in late March of 2014, as shown by the lower reaction highs. To the downside, we also see that BRCM prices are forming higher lows from the mid-April low. So we may also be seeing a symmetrical triangle forming for Broadcom, which is a classic continuation pattern in technical analysis.
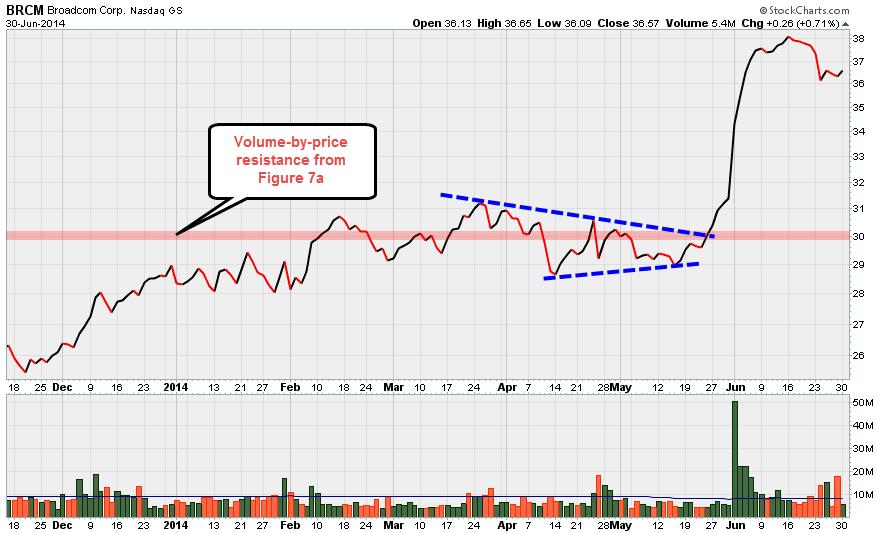
We see that there is a continuation in the upward movement in Broadcom shares in Figure 7b, as prices break out of both the triangle pattern and the volume-by-price resistance zone. Following this breakout, prices continue to surge higher to new highs in a matter of days.
Conclusion
As our examples have shown, volume-by-price is useful for identifying current or future support and resistance levels. The indicator identifies potential support (demand) when prices are above a long volume-by-price bar and possible resistance (supply) when prices are below a long bar.
Paying attention to the positive and negative volume makeup of a volume-by-price bar offers additional insights. Long green (positive volume) portions of a bar mean more demand that can further validate areas of resistance. Conversely, long red (negative volume) portions of a volume-by-price bar can further validate areas of resistance.
As is the case with any technical indictor, it is important to validate your findings with other indictors and analysis techniques.
Discussion
FREE REPORT

No comments have been added yet. Add your thoughts to the discussion!
You need to log in as a registered AAII user before commenting.
Log InCreate an account