
One of the fuzzier numbers in retirement planning is how much a person should save. Put another way, how much does an individual need to set aside each year to fund retirement expenses? It’s a function of projected expenditures, sources of other income (e.g., Social Security, inheritance, etc.) and expected investment returns. Though they are all interrelated, the link between covering projected expenditures and investment returns is not one-to-one.
I’ll start with the return side, because this is where the math gets interesting, and disconcerting. An analysis from AQR Capital Management found that even small changes in projected investment returns make a big difference in the amount to be saved. Altering the expected real (inflation-adjusted) annualized rate of return from 5.5% to 3.5% for a portfolio split between 60% in stocks and 40% in bonds increases the required savings rate from 8% to 15%. Yes, you read that right: A two-percentage point decrease in expected returns nearly doubles the amount you should save as a percentage of your salary.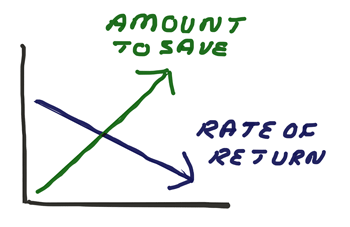
This works in the other direction too. Increasing the projected return by two percentage points from 4.5% to 6.5% cuts the required savings rate from 11% to 6%. Since the devil is always in the details, I’ll share a few of the assumptions used by AQR. The rates of return were adjusted to reflect inflation, which means they would be higher on an absolute basis—and most people default to viewing returns on an absolute basis. The savings rates included an employer match of 3% of a worker’s salary. A target income replacement rate of 75% of salary was used, with 30% coming from Social Security and other sources. The investing time span was 40 years. Wages grew 2% annually on an inflation-adjusted basis over the 40-year period. For those of you closer to retirement, shorter time periods can be easily calculated to show the impact.
Let’s assume a worker is 20 years from retirement and has already accumulated $100,000 in retirement plan savings. This worker saves 6% of his $100,000 salary and his employer gives him a 3% match. He also receives salary increases of 2% each year. At retirement, this person would have $512,000 in savings at a 3.5% annualized rate of return, $680,000 at a 5.5% rate of return and $911,000 at a 7.5% rate of return. To accumulate the same $911,000 at the lower rates of return, this worker would to have to increase his savings rate to more than 14% at the 5.5% rate of return and in excess of 20% at the 3.5% rate of return. I used annual instead of monthly assumptions and ignored inflation adjustments to make the math easier, but neither changes the main point: The less optimistic your long-term forecast is, the significantly more you should save.
The other side to this equation is your planned expenditures. Some of your future costs can be controlled by reducing housing costs and adhering to a stricter budget. Others cannot, such as medical care and food. It’s impossible to be precise with a forecast, but looking at your current budget should provide some idea of your spending habits (e.g., if you constantly eat out now, don’t assume you’ll suddenly start cooking most of the time in retirement). Commuting costs and work-related costs will drop and your kids, if you have children, will be (hopefully) financially independent. Retirement savings contributions will also end. On the other hand, you will have more free time on your hands. It’s better to be too conservative than too wishful.
A gap will exist if your expected return assumptions combined with your existing and planned savings do not match your expected retirement expenses. If so, rest assured that you are not alone. Many U.S. households are in this spot. You could increase your rate of return assumptions, but the comfort that a rosier projection brings will eventually be met by the cold reality of what future returns will actually be (and it’s possible that actual future returns could be better than you expect). Similarly, your retirement budget can be tightened, but there is a big difference between writing out a budget and sticking to it.
Ultimately, there are only a few levers to pull. Save as much as is reasonably possible without sacrificing enjoyment of your life (there’s always a balance in life to be struck.) Use any salary increases (including those from promotions and new jobs) to boost savings rates. Allocate more to stocks, but only to the extent you can avoid panicking during the next bear market. Lower your investment expenses as much as is reasonably possible. Consider delaying retirement until age 70 to maximize Social Security benefits and be able to set aside more. Once retired, move to a cheaper residence and consider working, perhaps in a completely different field, on a part-time basis. Most importantly, plan on being both disciplined and flexible. And realize that the future is likely to unfold in ways we don’t expect it to.

- Required Retirement Savings Rate Depends on Age and Income – The Center for Retirement Research at Boston College says the amount of income needed, the age when savings are started and the planned retirement age all influence how much should be saved.
- It’s Not Easy to Accumulate $1 Million in an IRA – An analysis by the U.S. Government Accountability Office (GAO) concluded that an investor would have to maximize contributions and stay fully allocated to the S&P 500 for 36 years to achieve an IRA balance of $1 million.
- How AAII Builds and Presents Stock Screens – AAII president John Bajkowski gives a behind-the-scenes look at our popular stock screens in his latest AAII Blog post.
- Investing to Avoid the Consequences of Being Wrong – In the new September AAII Journal, Bill Bernstein discusses his philosophy of minimizing the consequences of investing in a way that proves to be wrong.
- The Top ETFs Over Five Years: Health Care Loses Some Ground – Health care ETFs continue to rank among the best performers, but homebuilding, consumer staples and bond funds also made the Top 10 list.
The U.S. financial markets will be closed on Monday in observance of Labor Day.
September has historically been the worst month of the year for large-cap stocks. The S&P 500 index has only realized a September gain during 43% of all years since the start of 1946. The average September monthly loss has been 0.66%. To put these numbers into perspective, on an average calendar month, the large-cap index has gained 0.66% and risen 59% of the time.
Just two members of the S&P 500 are scheduled to report earnings: Hewlett Packard Enterprise Co. (HPE) on Wednesday and Kroger Co. (KR) on Friday.
The week’s first financial report will be the Institute for Supply Management’s (ISM) August non-manufacturing index, released on Tuesday. Wednesday will feature the Labor Department’s July Job Opening and Labor Turnover Survey (JOLTS) and the Federal Reserve’s periodic Beige Book.
Two Federal Reserve officials will make public appearances: San Francisco president John Williams on Tuesday and Boston president Eric Rosengren on Friday.
- From Saver to Spender: Managing Your Money in Retirement
- Advocating the Paycheck Strategy for Lifetime Investing
- Model Fund Portfolio: Introducing the Level3 Passive Portfolio
Pessimism among individual investors about the short-term direction of the market is above 30% for the first time in nine weeks, according to the latest AAII Sentiment Survey. Optimism and neutral sentiment, meanwhile, are both slightly lower.
Bullish sentiment, expectations that stock prices will rise over the next six months, declined 0.8 percentage points to 28.6%. Optimism was last lower on June 22, 2016 (22.0%). This is the 76th week out of the past 78 that optimism is below its historical average of 38.5%.
Neutral sentiment, expectations that stock prices will stay essentially unchanged over the next six months, pulled back by 1.1 percentage points to 39.9%. Even with the decline, this is the 31st consecutive week that neutral sentiment is above its historical average of 31.0%.
Bearish sentiment, expectations that stock prices will fall over the next six months, rose 1.9 percentage points to 31.5%. Pessimism was last higher on June 29, 2016 (33.4%). This week’s increase is not large enough to prevent bearish sentiment from staying below its historical average of 30.5% for a ninth consecutive week, however.
Optimism has now pulled back by a cumulative 7.0 percentage points since rising to its third-highest level of the year (35.6%) two weeks ago. Over the same period of time, pessimism has rebounded by 5.2%. Beyond the current stabilization of market prices following this summer’s rally, there has not been any new events to sway individual investors’ sentiment in one direction or the other over the past two weeks.
Rather, many individual investors continue to express concerns about valuations and/or are awaiting the outcome of the presidential election. Also keeping some individual investors bearish, or at least giving them reason to be cautious, are global economic uncertainty and disappointment with corporate earnings growth. Giving other individual investors reason for optimism are this summer’s upward movement in stock prices, the perceived lack of investment alternatives, corporate earnings and sustained, albeit slow, economic growth.
This week’s special question asked AAII members what they thought about the low level of volatility that has existed over the past several weeks. The responses were mixed. Nearly 17% described the low level of volatility as being normal for this time of year, and being attributable to the summer doldrums and/or vacations. Approximately 16% expect the markets to become more volatile soon, with some of these respondents believing that the jump in volatility will be event-driven. The presidential election was cited as reason for the low volatility by 15% of respondents. Slightly less than 18.5% of respondents are unsure about when volatility will return, describe investors and traders as being unsure about where the market is headed or think the market is currently stagnant. About 7% of respondents say they like the low level of volatility.
Here is a sampling of the responses:
- "In a range, waiting for the election outcome.”
- "Seems like a market that is confused. Priced too high, but thinks it may go higher.”
- "It is August; many people are on vacation.”
- "I like it!”
- "The market is waiting for a stimulus, a driving force one way or another.”
- "This is the calm before the storm. The market is peaking, and the volatility will return when the market begins to sell off.”

Bullish: 28.6%, down 0.8 points
Neutral: 39.9%, down 1.1 points
Bearish: 31.5%, up 1.9 points
Bullish: 38.5%
Neutral: 31.0%
Bearish: 30.5%
AAII Asset Allocation Survey
Exposure to equities reached its highest level in 13 months last month, according to the August AAII Asset Allocation Survey. At the same time, cash allocations fell to their lowest level in more than a year and fixed-income allocations declined modestly.
Stock and stock fund allocations rose 2.5 percentage points, to 66.6%. This was the largest allocation to equities since July 2015 (67.4%). The rise kept stock and stock fund allocations above their historical average of 60.5% for the 41st consecutive month.
Bond and bond fund allocations pulled back by 0.6 percentage points, to 17.4%. The decline reverses July’s increase. Nonetheless, fixed-income allocations remained above their historical average of 16.0% for the 13th consecutive month.
Cash allocations fell 1.8 percentage points, to 16.0%. Cash allocations were last lower in April 2015 (15.9%). Last month’s drop kept cash allocations below their historical average of 23.5% for the 57th consecutive month.
Since reaching a three-year high in February, cash allocations have declined during five out of the past six months. Over the same period of time, equity and fixed-income allocations have mostly been range-bound. The two exceptions were July’s three-year high for bond and bond fund allocations and last month’s 13-month high for equity allocations.
In general, individual investors are frustrated by the low yields on bonds, the low interest rates paid by savings and money market accounts, and the high valuations of stocks. Several AAII members have expressed a view of no good alternatives to stocks currently existing or have otherwise said that they feel like they are being forced to allocate more to stocks because of the current interest rate environment. At the same time, optimism about the short-term direction of stock prices continues to be below average, according our weekly Sentiment Survey.
Last month’s special question asked AAII members how the current economic environment is effecting their portfolio allocation decisions. More than four out of 10 respondents (42%) said the economy was not influencing their allocation decisions or indicated that they have not otherwise altered their allocations. Many of these respondents described themselves as long-term investors, though some said they are awaiting the outcome of the presidential election. Nearly 19% said that they are holding more cash or are otherwise investing more defensively. About 12% said they purposely upped their equity allocations, particularly to dividend-paying stocks. Some of these respondents said that the low-interest-rate environment has created a lack of good alternatives to stocks.
Here is a sampling of the responses:
- "It’s a consideration, but no change seems necessary.”
- "Keeping more cash, as oversold market is not supported by the economy or growth in corporate profits.”
- "Not at all. Keeping the course with my current strategy.”
- "Taking greater risk to try earn higher yields.”
- "It’s my age, not the climate. If I were younger, I would be aggressive all the way.”
- "The election scares me.”
- Stocks and stock funds: 66.6%, up 2.5 percentage points
- Bonds and bond funds: 17.4%, down 0.6 percentage points
- Cash: 16.0%, down 1.8 percentage points
- Stocks: 32.6%, up 3.4 percentage points
- Stock Funds: 33.9%, down 0.9 percentage points
- Bonds: 3.7%, up 0.4 percentage points
- Bond Funds: 13.7%, down 1.0 percentage points
Take the Asset Allocation Survey.
Local Chapter Meetings

August 25, 2016 Taking on Risk and Hoping the Strategy Doesn't Backfire
August 18, 2016 A Request to Parents of Gen Xers and Baby Boomers
August 11, 2016 Using ETFs to Identify Quality Stocks
August 4, 2016 Many ETFs Don’t Give You the Return You’re Expecting

