
The election day is just 12 days away, thank goodness. As it nears, articles and reports are appearing about the election’s impact on the market. We’re going to discuss the data in the November Stock Superstars Report, which will be posted online tomorrow evening, but I’ll share some of the data here as well. Rather than repeat what we’ll say in the SSR monthly report, I want to focus on sample size and our tendency to look for patterns—important concepts to keep in mind when reading commentary about how the presidential elections may influence stock market returns.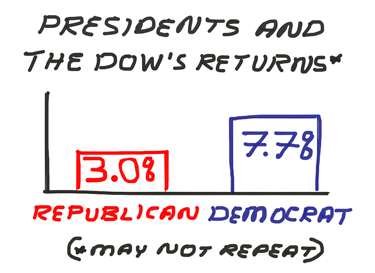
By sample size, I am referring to the amount of data analyzed for purposes of this discussion. We have a lot of data regarding anomalies such as valuation, momentum, company size, etc. The data not only goes back decades, but it also covers a variety of market and economic conditions. We also have defensible reasons to explain why they exist. Value stocks outperform because their prices reflect too much pessimism; small-company stocks benefit from less attention and a higher propensity to be mispriced, etc.
We have far less data when it comes to the impact of presidential elections. Yes, presidential elections have been conducted for over two centuries. The problem is that the data for analyzing the impact of elections on the financial markets is limited. Ned Davis Research’s analysis goes back only to 1900. This limits their election analysis to just 29 presidential elections. (The current election would be number 30.) Analyses based on post-World War II data, such as that conducted by Sam Stovall of CFRA, covers only 17 presidential elections. As you can see, the samples are not very big.
The sample size is even smaller when we divide it along partisan lines. There have only been 12 Republican presidents and eight Democratic presidents since 1900. Under their leadership, the Dow Jones industrial average realized 7.7% annualized returns when a Democrat occupied the White House and 3.0% annualized gains when a Republican resided at 1600 Pennsylvania Ave., according to Ned Davis Research. While this is the only data we have, questions have to be raised as to whether or not this sample is large and diverse enough to say with any certainty that stocks should continue to perform better with a Democrat serving as president as opposed to a Republican.
The even bigger question is: is this a repeatable pattern? Our brains are designed to seek out patterns. Being able to quickly equate a stalking animal in the weeds with danger enabled our ancestors to survive. In the modern world, this cognitive programming leads our brains to view a ball landing on black five times in a row on a roulette table as a reason to continue betting on black (or a higher probability of it landing on red), even though such streaks are normal part of random outcomes. While decisions made by each president, domestic events and global events have all impacted market returns, it’s challenging to argue that the return difference between Democratic and Republican presidents will continue or reverse without invoking political biases. Granted, one could conduct an in-depth analysis of each president’s policies and their impact on the economic and business environments during their terms, but we’ll never know what the outcomes would have been had different policies been implemented during the same period of time.
The analysis of election outcomes gets even more complicated when one when tries to set expectations for how the stock market will perform under various partisan mixtures of White House residency and congressional leadership. For example, 2011 through 2015 was the only four-year period since at least 1900 with a Democratic president and the two major parties splitting control of Congress. Should this be the outcome of next month’s elections—and I’m not predicting that it will be—do you want to base your portfolio decisions on what has happened just once before? I sure don’t.
The election will have an impact on the market. Depending on who wins the White House and how each party fares in the Congressional elections, government policies will be altered. This, in turn, will affect the economy and market perceptions about the economy. What I don’t know is how well the market’s returns will mimic the historical returns. I certainly don’t feel comfortable trying to set expectations based on it given the limited amount of data about how the market has performed following past election outcomes.
As I said above, we're programmed to seek out trends. We're not programmed to automatically question whether those patterns are repeatable. As such, we need to be careful before assuming a past pattern is indicative of future events.

- Using Seasonal and Cyclical Stock Market Patterns – The presidential cycle, in which stocks perform differently during each year of a president’s term, is just one of the patterns tracked by Jeffrey Hirsch.
- 15 Short-Cuts and Biases That Lead to Bad Investment Decisions – Sample size insensitivity is one of the 15 problematic thought processes singled out by portfolio manager Paul Szczygiel in this article.
- What You Need to Know About Bond Yields to Determine Your Returns – Measures beyond current yield can help you make better investment decisions.
- Focus on the Value of a Business, Not the Stock’s Valuation – Ariel fund manager Rupal Bhansali explains why intrinsic value is a better measure of a stock’s potential than market value.
It’s going to be another busy week for earnings, with 130 members of the S&P 500 scheduled to report. Included in this group is Dow Jones industrial component Pfizer (PFE), on Tuesday.
The Federal Open Market Committee will hold a two-day meeting starting on Tuesday. The CME’s FedWatch Tool currently assigns a greater than 90% chance of interest rates remaining unchanged. The statement will be released Wednesday at 2:00 p.m. ET and will be scrutinized for any suggestion of a rate hike occurring at the December meeting.
Elsewhere on the economic calendar, September personal income and the October Chicago Purchasing Manager’s Index (PMI) will be released on Monday. Tuesday will feature October motor vehicle sales, the October PMI manufacturing index, the Institute for Supply Management’s (ISM) October manufacturing index and September construction spending. The October ADP Employment Report will be released on Wednesday. Thursday will feature preliminary 2016 third-quarter productivity, September factory orders and the ISM’s October non-manufacturing index. October jobs data—including the unemployment rate and the change in nonfarm payrolls—as well as September international trade will be released on Friday.
Two Federal Reserve officials will make public appearances on Friday: Atlanta president Dennis Lockhart and Dallas president Rob Kaplan.
- The Importance of Diversification in Retirement Portfolios
- How Interest Rate Changes Affect the Price of Bonds
- 18 Recommendations for Minimizing Inheritance Conflict
Optimism among individual investors about the short-term direction of stock prices is below 30% for the 10th consecutive week. Neutral sentiment rebounded, while pessimism pulled back.
Bullish sentiment, expectations that stock prices will rise over the next six months, rebounded by 1.0 percentage points to 24.8%. Optimism is below its historical average of 38.5% for the 51st consecutive week and the 84th out of the past 86 weeks.
Neutral sentiment, expectations that stock prices will stay essentially unchanged over the next six months, rose 2.7 percentage points to 41.2%. The increase follows what had been a four-week low. It also keeps neutral sentiment above its historical average of 31.0% for the 39th consecutive week.
Bearish sentiment, expectations that stock prices will fall over the next six months, pulled back by 3.7 percentage points to 34.1%. Even with the decline, pessimism is above its historical average of 30.5% for the seventh time in nine weeks.
As noted above, the percentage of individual investors describing their short-term outlook as "bullish" has now been below 30% for 10 consecutive weeks. During six of those weeks, optimism has been below 28.0%, the breakpoint between the normal range of readings and unusually low readings. Not surprisingly, the S&P 500 and the Russell 2000 have both declined over this period.
Causing concern for individual investors is the lack of new market highs, the possibility of the stock market experiencing a larger drop, valuations, the November elections, global economic uncertainty and the pace of corporate earnings growth. Giving other individual investors reason for optimism are the perceived lack of investment alternatives, corporate earnings, low/stable energy prices and sustained, albeit slow, economic growth.
This week’s special question asked AAII members how the inability of stocks to retest or rise above their summer highs is influencing their outlook. Nearly one out four respondents (24%) said that the price action has caused them to be pessimistic or cautious. Conversely, a similar number of respondents said that their outlook is not being influenced by the inability of stocks to rise to new highs or that the recent price action is having little influence on their outlook. Several of these respondents described themselves as long-term investors. Approximately 13% of respondents are waiting to see the results of the election before setting short-term expectations. Another 11% are waiting for a catalyst to drive stocks in one direction or another. Slightly more than 9% view the lack of new highs as a positive sign.
Here is a sampling of the responses:
- “When we get through this crazy presidential race, maybe we can get a better idea of where we’re going.”
- “Confirms my belief that we are entering a bear market.”
- “It feels like the market is consolidating and is positioning itself for the next move up.”
- “Little or no effect. I’m unconcerned about short-term indicators.”
- “No influence. I’m awaiting the election results and the restart of interest rate increases.”

Bullish: 24.8%, up 1.0 points
Neutral: 41.2%, up 2.7 points
Bearish: 34.1%, down 3.7 points
Bullish: 38.5%
Neutral: 31.0%
Bearish: 30.5%
Local Chapter Meetings

October 20, 2016 Earnings Estimates’ Effect on Stock Prices
October 13, 2016 You Could Spend More Years Being Retired Than Working
October 6, 2016 Too Much Confidence Is Bad for Your Portfolio
September 29, 2016 The Federal Reserve’s Falling Growth Forecasts

