
Save the Date! Our 2017 Investor Conference will be held November 3-5 at the Loews Royal Pacific Resort in Orlando, FL. We’re scheduling many great speakers for the event, including Mark Hulbert, John Buckingham and Wesley Gray among others. You’ll also get to meet my fellow colleagues as well as other AAII members. It’s always a great event.
This week’s commentary was originally going to feature highlights from Warren Buffett’s annual letter to Berkshire Hathaway (BRK.B) shareholders, but then a price war erupted among the discount brokers. On Tuesday morning, Fidelity cut its commissions for buying and selling stocks online to $4.95 per trade on, down from $7.95. Literally hours later, Charles Schwab responded by cutting its commissions to $4.95. The move came after Schwab had already lowered its commissions to $6.95 a few weeks earlier. On Tuesday night, TD Ameritrade announced that its commissions will be $6.95 starting on March 6, down from $9.95. Then this morning, E*Trade cut its commissions from $9.95 to $6.95. Scottrade is still charging $7, but the firm is being acquired by TD Ameritrade.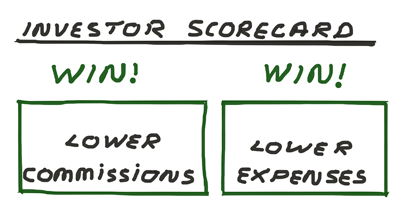
Saving $6 cumulatively on a roundtrip trade—or in Schwab’s case, $8 relative to the start of February—isn’t, by itself, going to make any one significantly wealthier. Costs and savings, however, are cumulative. Even at just five buy/sell transactions a year, the savings amount to an extra $300 over the course of a decade—and that’s before factoring in the impact of compounding.
The lower commissions are particularly helpful to those with less money to invest. Investing $1,000 into a stock at $9.95 per trade causes 2% to be lost to commissions ($19.90 / $1,000 = ~2%). Put another way, the stock has to beat a no-commission S&P 500 index fund by at least 2% on a total return basis just to get the investor back to breakeven. At $4.95 per trade, the drag decreases to approximately 1%.
Just a few trading days before the discount broker war started, Vanguard lowered fees on 68 of its mutual funds and ETFs. (The full list is here.) The advantage of Vanguard’s price cut will be reaped the most by those investors who buy and hold. Every extra year a fund with a reduced fee is held is a year an investor gets to keep and compound more of the investment in that fund. In absolute terms, the actual savings will depend on how much you have invested. Vanguard’s reductions mostly range between one to four basis points. These are equivalent to $1 to $4 per year for every $10,000 invested. Though not seemingly large, these savings do add up and they keep adding up over time.
Even those who are not clients of Fidelity, Schwab, TD Ameritrade, E*Trade or Vanguard benefit. The cuts to their fees put pressure on their competitors to follow. We’ve particularly seen this occur in the ETF industry, with Vanguard and BlackRock’s iShares among those driving costs lower. We’re also seeing expense ratios for mutual funds trend lower. The average expense ratio for many of the categories in our mutual fund guide are lower now than they were five years ago.
All of this brings me back to the Berkshire Hathaway shareholder letter. In this year’s musings, Buffett devoted nearly five full pages to the topic of fees and active management. Among the points he made is that in investing, paying more often gets people inferior products and services. If this seems ironic, consider Buffett’s $1 million bet against hedge funds.
Buffett bet that an index fund [he chose the Admiral share class of the Vanguard 500 index fund (VFIAX)] could beat a portfolio of hedge funds over a 10-year period after fees, costs and expenses are accounted for. Ted Seides of Protege Partners bet that hedge funds would do better. He chose five funds-of-funds that cumulatively invest in more than 100 hedge funds. With one year left to go (the bet started in 2008), the Vanguard fund has an annualized return of 7.1%. The hedge fund portfolio is trailing significantly with an annualized return of just 2.2%.
A big hurdle facing Seides has been costs. Hedge funds are known for charging “2 and 20,” which is industry lingo for 2% annually of invested assets and 20% of profits. Fund-of-funds managers overlay an additional 1% for their services. Buffett estimates these fees have diverted roughly 60% of the gains back to the hedge fund and fund-of-funds managers. Paraphrasing the fictional Gordon Gekko, Buffett quipped, “fees never sleep.”
The irony of investing is that the more money you have, the more opportunity you have to pay fees. Advisers and access to more restricted products (hedge funds, private equity, venture capital, etc.) come with higher costs. Yet this expanded access often doesn’t translate into better returns. Buffett summed up the problem by writing, “My calculation, admittedly very rough, is that the search by the elite for superior investment advice has caused it, in aggregate, to waste more than $100 billion over the past decade.” He further called this calculation “conservative.”
Costs matter, always. Every dollar you save is a dollar you get to keep and realize compounded returns on. Every dollar wasted on unnecessary costs and fees is a dollar you will never see again. As is the case with many other things, ask whether or not you are getting enough value to justify the costs. Good advice, information, education and portfolio management can be justified; high commissions cannot. Neither can high-fee funds that do not beat their low-cost index fund brethren.

- Six Questions With Jack Bogle – Buffett called Bogle “a hero” for the money he has saved investors. Here are Bogle’s suggestions on how to be a better investor.
- Insights on Warren Buffett From His Friend and Editor – Carol Loomis, formerly with Fortune, edits Buffett’s annual letters and shared her insights on the legendary investor.
- The Top Mutual Funds Over Five Years: Health Care’s Dominance Is Weakening – Not all mutual funds underperform; some have realized big gains for their shareholders.
- A More Aggressive Approach for the Model Fund Portfolio – AAII founder Jim Cloonan’s latest changes are intended to give the portfolio more exposure to intermediate-term trends.
My colleague Wayne Thorp will explain how to determine a stock’s worth to our Baton Rouge Chapter on Saturday, March 11.
Fourth-quarter earnings season is winding down with six members of the S&P 500 scheduled to report: Brown-Forman Corp. (BF.B), H&R Block (HRB) and Urban Outfitters (URBN) on Tuesday, and Signet Jewelers (SIG) and Ulta Beauty (ULTA) on Thursday.
The week’s first economic reports will be January factory orders, which will be released on Monday. Tuesday will feature January international trade data. The February ADP Employment Report and revised fourth-quarter productivity will be released on Wednesday. Thursday will feature February import and export prices. The February jobs data—including the change in nonfarm payrolls and the unemployment rate—will be released on Friday.
Minneapolis Federal Reserve bank president Neel Kashkari will make a public appearance on Monday.
The Treasury Department will auction $24 billion of three-year notes on Tuesday, $20 billion of 10-year notes on Wednesday and $12 billion of 30-year bonds on Thursday.
- Reduce Stock Exposure in Retirement, or Gradually Increase It?
- The Big Picture: How to Determine the Stock Market's Direction
- Strategies for Unneeded RMDs
Pessimism among individual investors about the short-term direction of stock prices is at its highest level in more than four months. At the same time, optimism is near, though slightly below, its long-term average. The survey period runs from Thursday through Wednesday. Most of the votes were recorded before yesterday, when the Dow Jones industrial average rose above 21,000.
Bullish sentiment, expectations that stock prices will rise over the next six months, declined 0.6 percentage points to 37.9%. The modest decrease follows what had been a six-week high. The historical average is 38.5%.
Neutral sentiment, expectations that stock prices will stay essentially unchanged over the next six months, fell 2.8 percentage points to 26.5%. Neutral sentiment was last lower on December 21, 2016 (26.2%). The historical average is 31.0%.
Bearish sentiment, expectations that stock prices will fall over the next six months, rose 3.3 percentage points to 35.6%. Pessimism was last higher on October 19, 2016. The increase keeps bearish sentiment above its historical average of 30.5% for the sixth time in seven weeks.
All three of the sentiment indicators remain well within their typical historical ranges. The potential impact that President Trump could have on the domestic and global economy continues to cause uncertainty and/or concern among some investors, while encouraging others. Some individual investors view the market’s upward momentum as positive. Others worry that the sharp upward run will lead to a forthcoming drop in stock prices.
This week’s special question asked AAII members what factors are most influencing their six-month outlook for stocks. Nearly three-quarters of respondents (73%) cited national politics, particularly President Trump’s polices and what actions Congress may take. Tax reform was mentioned by many (20% of respondents), followed by regulatory reform and uncertainty over what legislation will actually be passed. Just under 23% of all respondents listed the ongoing rally and the prevailing stock valuations, with several of these respondents expressing concerns about the level of valuations or that a drop could be forthcoming. Monetary policy was cited by 8% of all respondents, followed by corporate earnings growth (7%) and investor sentiment (7%). Some respondents listed more than one factor.
Here is a sampling of the responses:
- “Actions taken by the Trump administration to improve the business climate in the U.S.”
- “The run-up has been too good for too long. It is time for a correction.”
- “Optimism, less regulation, lower corporate taxes and better earnings.”
- "Uncertainty regarding the Trump administration and direction of the country, both domestically and internationally.”
- "Recent increase in market price in excess of earnings growth.”

Bullish: 37.9%, down 0.6 points
Neutral: 26.5%, down 2.8 points
Bearish: 35.6%, up 3.3 points
Bullish: 38.5%
Neutral: 31.0%
Bearish: 30.5%
AAII Asset Allocation Survey
The proportion of fixed-income investments in individual investors’ portfolios was at a six-month high last month, according to the February AAII Asset Allocation Survey. Both equity and cash allocations declined.
Stock and stock fund allocations declined for a third consecutive month, falling 0.5% to 65.5%. Even with the decline, February marked the 47th consecutive month that equity allocations were above their historical average of 60.5%.
Bond and bond fund allocations rose 0.9 percentage points, to 17.3%. This was the largest fixed-income allocation recorded by our survey since August 2016 (17.4%). February was also the 18th out of the past 19 months with fixed-income allocations above their historical average of 16.0%.
Cash allocations declined by 0.5 percentage points, to 17.2%. The decline kept cash allocations below their historical average of 23.5% for the 63rd consecutive month.
Many individual investors remained cautious about the six-month outlook for the stock market. During the first half of February, optimism in our weekly Sentiment Survey was below average. At the same time, a pullback in yields boosted the value of bonds.
Playing a role in individual investors’ views of the financial markets are the new Trump administration, valuations for both stocks and bonds, and monetary policy. At the same time, many of our members take a long-term view toward their portfolio allocation.
Last month’s special question asked AAII members why or why not record highs (such as the Dow’s rise above 20,000) influence their asset allocation decisions. Slightly more than half of all respondents (53%) said that they do not alter their allocations in reaction to record highs, though their reasons varied. Several said that they focus on the long term, some said the Dow Jones industrial average is not a good benchmark to use and a few said that they are more focused on President Trump. Nearly 7% of all respondents said they have rebalanced their portfolios. About 13% either reduced their equity allocations or increased their cash holdings due to valuations or concerns about a forthcoming correction. An additional 4% said that they are taking a more cautious approach to investing.
Here is a sampling of the responses:
- “I invest in individual stocks and bonds, not the Dow. The 20,000 number is irrelevant to my investing philosophy.”
- “Strategy is long-term, hence interim highs and lows do not matter.”
- “I’m very selective with stock selection at this time.”
- “Market is getting toppy, so I am cautious. Keeping more cash than usual so I have something to invest when the correction comes.”
- “I am happy when the market is high. However, I don’t make changes other than rebalancing twice a year.”
- Stocks and stock funds: 65.5%, down 0.5 percentage points
- Bonds and bond funds: 17.3%, up 0.9 percentage points
- Cash: 17.2%, down 0.5 percentage points
- Stocks: 26.9%, down 4.2 percentage points
- Stock funds: 38.6%, up 3.8 percentage points
- Bonds: 3.3%, down 0.1 percentage points
- Bond funds: 14.0%, up 1.0 percentage points
Take the Asset Allocation Survey.
Local Chapter Meetings

February 23, 2017 Market Meltup Creates Pressure to Own Stocks
February 16, 2017 Having Choice and Guidance Isn’t Always a Good Thing
February 9, 2017 How I Choose a Stock to Buy or Sell
February 2, 2017 How I Analyze Earnings Releases

