
We are currently in the heart of fourth-quarter earnings season. The release of results is clustered in the mornings and afternoons, particularly between Tuesdays and Thursdays. Depending on what’s in your portfolio, it can be tough to keep up with all of the news. For instance, I had a two-day span last week when four companies I either personally follow or track for our Dividend Investing portfolio reported.
 Fortunately, from years of analyzing earnings releases I’ve learned techniques to streamline the process. It’s not a completely formulaic process since every company has different divisions and statistics. Some even release different documents. I’ve seen companies issue press releases, spreadsheets and even PowerPoint slides.
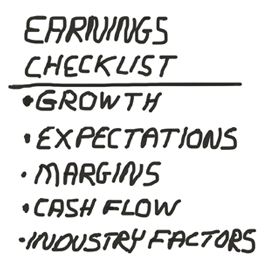
Hone in on Revenue, Earnings per Share and Net Income—The very first thing to do is to determine the rate at which revenues, earnings per share (EPS) and net income have changed. Have they grown or decreased compared to the same period a year ago? How do the growth rates for each line item compare to the other two? If profits grew faster than sales, the company’s margins widened. If sales grew faster, margins shrank. If EPS grew faster than net income, then EPS was boosted by a reduction in the share count. Depending on how the earnings release is formatted, it can be easier to simply calculate the growth rates yourself.
Compare EPS to Expectations—In any given quarter, about two-thirds of companies tracked by analysts beat the consensus earnings estimate. A miss should be explained by the company. If it’s merely the timing of a key order or another temporary event, it may be justified to give the company a pass on an earnings miss. If the company simply disappointed and you didn’t intend for the stock to be a contrarian play when you bought it, consider whether or not your sell rules are being violated. (Earnings estimates can be found on most financial websites, including AAII.com. Type in a ticker in the “Markets” section of the AAII.com home page to call up a stock quote and then click on “Earnings” from the quote page menu.)
Examine Margins—A company’s executive team will do their best to put a positive spin on earnings, but profit margins may tell you a different story. Look to see whether gross margins (gross profits divided by revenues) and operating margins (operating profits divided by revenues) increased or decreased. Then look through the narrative of the press release to find out why margins changed. If margins narrowed, determine if it is the result of competitive pressures, a change in the product mix or some other factor such as higher raw material costs.
Calculate Free Cash Flow—Not all companies release their cash flow statement with their earnings, but many do. If so, calculate how much free cash a company generated. At AAII, we calculate free cash flow as cash flow from operating activities less capital expenditures and dividend payments. It should generally be positive unless the company had a big expenditure, such as a plant expansion, or the company has a seasonal business pattern. Some companies will talk about their EBITDA (earnings before interest, taxes, depreciation and amortization) figure. It’s a proxy for free cash flow, but the cash flow statement is harder to manipulate through accounting decisions than the income statement is.
Check Industry-Specific Factors—There is no substitute for knowing the company you are analyzing, since key metrics will vary especially depending on the industry it operates in. For hotel companies, such as Wyndham Worldwide (WYN), RevPAR (revenue per available room) matters. For insurance companies such as UnitedHealth (UNH), the combined ratio (the percentage of premiums paid out as claims) matters. Airline companies, such as Alaska Air Group (ALK) report load factor, a measure of how full their planes are. (Investors want the number to be high, travelers want the number to be low.) The key here is to figure out what the key trends in a company’s business are and then look for the data and commentary in the press release that show how those trends are evolving.
Look Over Other Information—I will read through the earnings press release and scan through the conference call transcript. I’m looking for color on what is happening with the business and within the industry. If there is guidance, I will compare it to the guidance given in the previous quarter. Some companies may also announce dividends or changes to their stock buyback programs in conjunction with announcing their results.
Keep Notes—Maintaining a log of a how a company is performing will help you identify trends as they evolve. These notes do not have to be formal, or even in complete sentences. They only have to be in a form you understand and can quickly refer back to. Jot down a quick summary of the data from the points above as well as reasons to explain the trends.
I’ll admit that doing this type of analysis does require some time and effort, but it takes less than you might think. I can often get through an earnings announcement in 15 to 20 minutes, including taking notes. By making the effort, I learn what is going on with the company and can better determine if the stock still matches my reasons for buying it.
- 16 Financial Ratios for Analyzing a Company’s Strengths and Weaknesses – Ratios allow you to determine whether a company is performing as well as or worse than its executives would have you believe.
- What You Can Learn from Shareholder Letters – Commentary from a company’s executives can add valuable color to the numbers if you know what to look for.
- The Individual Investor’s Guide to the Top Mutual Funds 2017 – The online version of our mutual fund guide has all new features, including reports for each fund.
- Strategies for Unneeded RMDs – Suggestions on what retirees who do not need the money can do with required minimum distributions from retirement.
Fourth-quarter earnings season moves forward with 87 members of the S&P 500 scheduled to report. Included in this group are Dow Jones industrial components Walt Disney Co. (DIS) on Tuesday and Coca-Cola (KO) on Thursday.
The week’s first economic reports will be December international trade and the Labor Department’s December job openings and labor turnover survey (JOLTS), which will be released on Tuesday. Friday will feature January import and export prices, the preliminary University of Michigan February consumer sentiment survey and the January Treasury budget.
Four Federal Reserve officials will make public appearances: Philadelphia president Patrick Harker on Monday; St. Louis president James Bullard and Chicago president Charles Evans on Thursday; and vice chairman Stanley Fischer on Friday.
The Treasury Department will auction $24 billion of three-year notes on Tuesday, $23 billion of 10-year notes on Wednesday and $15 billion of 30-year bonds on Thursday.
- Deep Value Investing Has Not Gone Out of Style
- Vanguard's Dynamic Spending Strategy for Retirees
- Protect Your Capital: Never Chase High Yield
The percentage of individual investors describing their short-term market outlook as "neutral" decreased from last week, while pessimism has now been above 30% for three consecutive weeks for the first time since the election, according to the latest AAII Sentiment Survey. Optimism bounced back slightly after declining three weeks in a row.
Bullish sentiment, expectations that stock prices will rise over the next six months, increased 1.2 percentage points to 32.8%. Optimism was last lower on November 2, 2016 (23.6%). The historical average is 38.5%.
Neutral sentiment, expectations that stock prices will stay essentially unchanged over the next six months, declined 1.9 percentage points to 33.0%. This is the fourth time neutral sentiment has been above its historical average of 31.0% since the election.
Bearish sentiment, expectations that stock prices will fall over the next six months, edged up 0.7 percentage points to 34.2%. Pessimism was last higher on November 2, 2016 (34.3%). This is the first time that bearish sentiment is above its historical average of 30.5% for three weeks in a row since the election.
Since starting 2017 at 46.2%, bullish sentiment has pulled back by a cumulative 13.4 percentage points. Over the same period, neutral sentiment and bearish sentiment have risen by 4.5 and 8.9 percentage points, respectively. (The numbers are rounded.) All three of the indicators remain within their typical historical ranges.
At time of publication, the Dow Jones industrial average, S&P 500 and NASDAQ Composite are all on course for weekly losses. U.S. indexes have pulled back in recent sessions, as investors weigh the potential headwinds and tailwinds of President Trump’s potential policies. On the one hand, tax cuts and fiscal stimulus could boost the U.S. economy, but on the other, protectionist policies could hamper foreign trade.
Also influencing investor sentiment are valuations, earnings, consumer sentiment and the magnitude and timing of future interest rate increases. According to Thomson Reuters, roughly 44% of S&P 500 companies have reported quarterly earnings, and of those that have reported, 66% have beaten earnings expectations while 48% have beaten revenue expectations.
This week’s special question asked AAII members to explain how, if at all, the Dow’s rise above 20,000 influences their expectations for the stock market. Over half of the respondents said that the Dow’s recent performance has little to no influence on their expectations. Roughly 15% of respondents said that the Dow’s recent performance gives them a more optimistic stance on what’s to come; some even mentioned the possibility of an improving economy because of Trump’s election. Slightly over a quarter of respondents said that the Dow’s performance presents a selling opportunity, or confirms that the market is overvalued.
Here is a sampling of the responses:
- “20,000 on the Dow does not influence my expectations. My investment focus is long-term.”
- “It’s just a number, but I sense a turning point for the better under our new president.”
- “I am more interested in the financials of individual stocks than the Dow Jones industrial average.”
- “Bad things happen after you hit all-time highs. The fundamentals are just not there to support these high market valuations.”
- “Phony rally based on wild expectations of what a Trump presidency really means. The market is way overvalued and heading for a major fall.”
- “The number is meaningless but I do think the market is currently overvalued. Expectations are too high.”

Bullish: 32.8%, up 1.2 points
Neutral: 33%, down 1.9 points
Bearish: 34.2%, up 0.7 points
Bullish: 38.5%
Neutral: 31.0%
Bearish: 30.5%
AAII Asset Allocation Survey
Stock and stock funds accounted for 66.0% of the average individual investor portfolio, according to the January AAII Asset Allocation Survey. Cash allocations fell last month to 17.7% of the average investor portfolio, 5.8 percentage points below the long-term average of 23.5%. Cash allocations have been slowly declining since February 2016, when portfolio allocations to cash registered 21.3%. Over that same time frame, investor allocations to stocks rose from 61.5% of the average individual investor portfolio to 66.0%, reported by members of the American Association of Individual Investors during January 2017.
Cash allocations declined by 0.2 percentage points, to 17.7%. Cash allocations have registered below their historical average of 23.5% for the 62nd consecutive month.
Stock and stock fund allocations declined by a very modest 0.3 percentage points, to 66.0%. January was the 46th consecutive month with equity allocations above their historical average of 60.6%.
Bond and bond fund allocations increased 0.6 percentage points, to 16.4%. The historical average is 15.9%.
Last month’s special question asked AAII members what, if any, allocation changes they expected to make this year. An equal percentage of respondents indicated that they planned to increase their allocation to equities and indicated that they were planning no change. Around 27% of respondents said they were happy with their allocation and were not planning any change. Around 27% of the respondents noted that they were planning to increase their allocation to stocks and stock funds, while 12% were anticipating decreasing their allocation to equities. A total of 11% noted that they were going to increase their bond positions, while 5% of the individual investors indicated there were going to reduce their allocation to bonds and bond funds. A total of 13% of the respondents indicated that they were planning on increasing their cash allocations, while 6% noted that they would decrease their cash allocations.
Here is a sampling of the responses:
- “I increased my exposure to stocks and reduced my cash as I don’t see much value in holding cash other than for daily expenses and my emergency fund.”
- “None; my overweighting in stocks is due to recent market increases. Over time, the allocations will normalize when the market goes through a correction.”
- “I still think the best place to be is in stocks and plan to stay the course in stocks.”
- “Later this summer I may invest more in stocks, depending on how the new president’s plans for the economy are accepted and implemented.”
- “Reduce my allocation to individual stocks. Am uncertain about new administration.”
- “I expect to maintain my 60/40 position.”
- “Increase cash somewhat to get about three years of living expenses in cash. I’m migrating to Cloonan’s “Level 3” approach.”
- Stocks and stock funds: 66.0%, down 0.3 percentage points
- Bonds and bond funds: 16.4%, up 0.6 percentage points
-
Cash: 17.7%, down 0.2% percentage points
Note: Figures may not add to 100% due to rounding.
- Stocks: 31.2%, up 1.2 percentage points
- Stock funds: 34.8%, down 1.6 percentage points
- Bonds: 3.4%, up 0.6 percentage points
- Bond funds: 13.0%, unchanged
- Cash: 17.7%, down 0.2% percentage points
Take the Asset Allocation Survey.
Local Chapter Meetings

January 26, 2017 Putting Dow 20,000 Into Context
January 19, 2017 Know When to Sell Before You Have To
January 12, 2017 A Simple Solution to Offering an Active ETF
January 5, 2017 Is Now a Good Time to Invest in Stocks?

