
In its purest form, value investing involves solely buying cheap companies. Just cheap companies. Studies of valuation either use high minus low (buying the cheapest stocks and shorting the most expensive stocks) or separate stocks into deciles (10 evenly split groups) or quintiles (five evenly split groups) based on their relative valuation ratios. No consideration is given for any other characteristics.
The big challenge with a pure value strategy (or a pure momentum, a pure growth strategy, etc.) is the actual stocks designated for purchase. In the case of value, an investor will end up looking at a list of stocks so unattractive that they are unlikely to even be allowed to entry into the building where a beauty contest is being held. There will be more than enough stocks with big enough flaws and risks to cause an investor to openly question the rationality of following the strategy.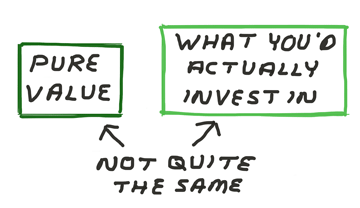
A way around this problem is to require stocks to have additional characteristics. In “Fact, Fiction and Value Investing,” Clifford Asness et al. explained how including momentum and profitability components in a value strategy increased risk-adjusted returns. Strong momentum occurs when a stock’s return is above average over a period of time (e.g., 26 weeks). Profitability, as the word implies, means a company is making money.
Taking a step back to look at the bigger picture reveals why this would be the case. Value occurs when perceptions about the company drive down the price investors are willing to pay relative to a fundamental metric (book value, earnings, cash flow, etc.) Momentum occurs when investors buy or hold onto to a stock because its price is rising. Profitability implies the company is making money, and investors mostly prefer companies that are expected to make money over those that aren’t. (There are always some speculative exceptions to this from time to time.) Combining momentum and profitability (or a broader measure of quality) results in both finding stocks recognized as bargains by other investors and reducing the odds of buying stocks that are cheap for a reason. The diversification benefits of momentum and profitability relative to value are the icing on top of the cake—and tasty icing at that.
Here at AAII, our value-oriented portfolios are not pure value. The Model Shadow Stock Portfolio uses profitability as a criterion for adding and selling a stock. The portfolio also requires stocks to have a relative price strength rank (the measure of momentum) within the top half of all stocks in order to be considered as buy candidates. The AAII Dividend Investing portfolio requires underlying financial strength and dividend growth in addition to an attractive valuation. Even the value strategies used within our Stock Superstars Report portfolio include quality components.
It’s not just us. The renowned value investor Warren Buffett evolved from Benjamin Graham’s “cigar-butt” strategy to considering quality as well. (The term “cigar butt” refers to picking up discarded cigars with one puff left, meaning companies with some semblance of intrinsic value left in them.) Joel Greenblatt’s Magic Formula requires companies to earn a minimum return on their capital. These men are far from being alone.
Investing in cheaply valued stocks works really well over the long term. (Over short periods of time, any style of investing can and will flop.) The challenge comes from purely investing in value with no consideration for any other factors. Though pure value works mathematically when a large enough number of stocks is purchased, the strategy requires a strong tolerance for owning very risky companies. Incorporating additional traits will make the stocks you identify more palatable with potentially even higher returns.

- Five Common Traits of Success Value Screens – AAII President John Bajkowski revealed the common traits AAII’s value screens share.
- Selecting a Valuation Method to Determine a Stock’s Worth – There is more than one way to value a stock; this 2014 AAII Journal article provides guidance on which metric(s) to use.
- Leveraged ETFs: Multiplying by the Unknown – The actual returns from these funds will be less than their names would imply due to a decay in leverage over time.
- Inherited IRA Rules for Spouses, Heirs and Trusts – Inherited IRAs differ from traditional and Roth IRAs, with the rules dependent on who the beneficiary is.
Computerized Investing editor Jaclyn McClellan will speak with our Cleveland Chapter about robo-advisers on Wednesday. If you’re not in the Cleveland metro area or otherwise cannot make the meeting, you can see Jaclyn this November at our Investor Conference.
The earnings calendar lists 71 S&P 500 member companies as being scheduled to report. Included in this group are nine Dow components: Goldman Sachs Group (GS), Johnson & Johnson (JNJ), UnitedHealth Group (UNH) and International Business Machines (IBM) on Tuesday; American Express Co. (AXP) on Wednesday; Microsoft Corp. (MSFT), Visa (V) and Travelers Companies (TRV) on Thursday; and General Electric Co. (GE) on Friday.
The week’s first economic reports will be the July Empire State Manufacturing Survey, released on Monday. Tuesday will feature June import and export prices and the July Housing Market. Wednesday will feature June housing starts and building permits. The Philadelphia Fed's July Business Outlook Survey will be released on Thursday.
The Treasury Department will auction $13 billion of 10-year TIPS on Thursday.
- A Key to a Lasting Retirement Portfolio
- 16 Financial Ratios for Analyzing a Company’s Strengths and Weaknesses
- Aging’s Adverse Impact on Decision Making
The proportion of individual investors describing their outlook for stock prices as “neutral” is above 40% for a third consecutive week. This is the first such streak in nearly a year. The latest AAII Sentiment Survey also shows small declines in both optimism and pessimism.
Bullish sentiment, expectations that stock prices will rise over the next six months, declined 1.3 percentage points to 28.2%. Optimism was last lower on May 31, 2017 (26.9%). The decline keeps bullish sentiment below its historical average of 38.5% for the 20th consecutive week and the 25th time out of the last 26 weeks.
Neutral sentiment, expectations that stock prices will stay essentially unchanged over the next six months, rebounded by 1.6 percentage points to 42.1%. Neutral sentiment remains above its historical average of 31.0% for the 11th consecutive week and the 16th out of the last 17 weeks.
Bearish sentiment, expectations that stock prices will fall over the next six months, declined by a modest 0.2 percentage points to 29.6%. Pessimism remains below its historical average of 30.5% for the ninth time out of the last 11 weeks.
At current levels, optimism is right at the border between typical and unusually low readings. Bullish sentiment levels of 28.1% or lower are considered unusually low. Historically, unusually low levels of optimism have been followed by better-than-average gains in the S&P 500 index over the next six- and 12-month periods. There is no guarantee that these trends will continue in the future.
The last time neutral sentiment was above 40% on three consecutive weeks was July 27 through August 10, 2016. Readings above 40% are unusually high (more than one standard deviation above average).
Bullish sentiment has been gradually trending lower over the past three weeks. Though the Dow Jones industrial average set a new record high yesterday, it, the S&P 500 and the Russell 2000 index were generally lower over most of this week’s survey period. Still, some individual investors remain encouraged by this year’s record highs for the Dow, the S&P 500 and the Nasdaq. However, others fret about the level of valuations. The Trump administration’s ability (or lack thereof) to move forward on economic and tax policy remains at the forefront of many investors’ minds and is having a significant impact on sentiment. Other factors playing roles are earnings, concerns about the possibility of a pullback in stock prices and interest rates/monetary policy.
This week’s special question asked AAII members how they perceived the performance of the stocks they own or follow relative to the year-to-date returns of the S&P 500. The majority of responses fell into one of two groups. The first group, accounting for more than a third of all respondents (nearly 37%), described their returns as comparable or similar. The second group, also nearly 37%, said the returns of the stocks they own or follow have been better than the large-cap index. About 23% said the stocks they own/follow have had lagged the S&P 500.
Here is a sampling of the responses:
- “About equal to the performance of the S&P 500.”
- “I am beating all indexes.”
- “Similar in performance, except for my individual tech stocks, which have outperformed.”
- “Above S&P 500, on par with the Nasdaq.”
- “Mixed. Some stocks track the indexes, some do better and some do worse.”
- “Below average because I have become more defensive since the rapid run-up in stock prices.”

Bullish: 28.2%, down 1.3 points
Neutral: 42.1%, up 1.6 points
Bearish: 29.6%, down 0.2 points
Bullish: 38.5%
Neutral: 31.0%
Bearish: 30.5%
Local Chapter Meetings

July 6, 2017 Two Concepts That Can Affect Your Returns
June 29, 2017 Implications of the Declining Number of Stocks
June 22, 2017 Don’t Like Volatility? Take a Longer-Term View
June 16, 2017 Is It Active or Passive?

