



The 2023 review of AAII Stock Screens reveals the top-performing strategies for the past year and over the total history of our tracking.
Table 2 presents the current characteristics of the top- and bottom-performing screening strategies for 2023 and the risk-adjusted winners and losers since the start of 1998.
Forty-eight of the 55 AAII Stock Screens posted gains for the year through December 13, 2023, quite a reversal from last year when only nine screens were in the black. The median gain for the screening methodologies we track is 12.7% year to date. By comparison, the large-cap S&P 500 index is up 22.6% through December 13, 2023.
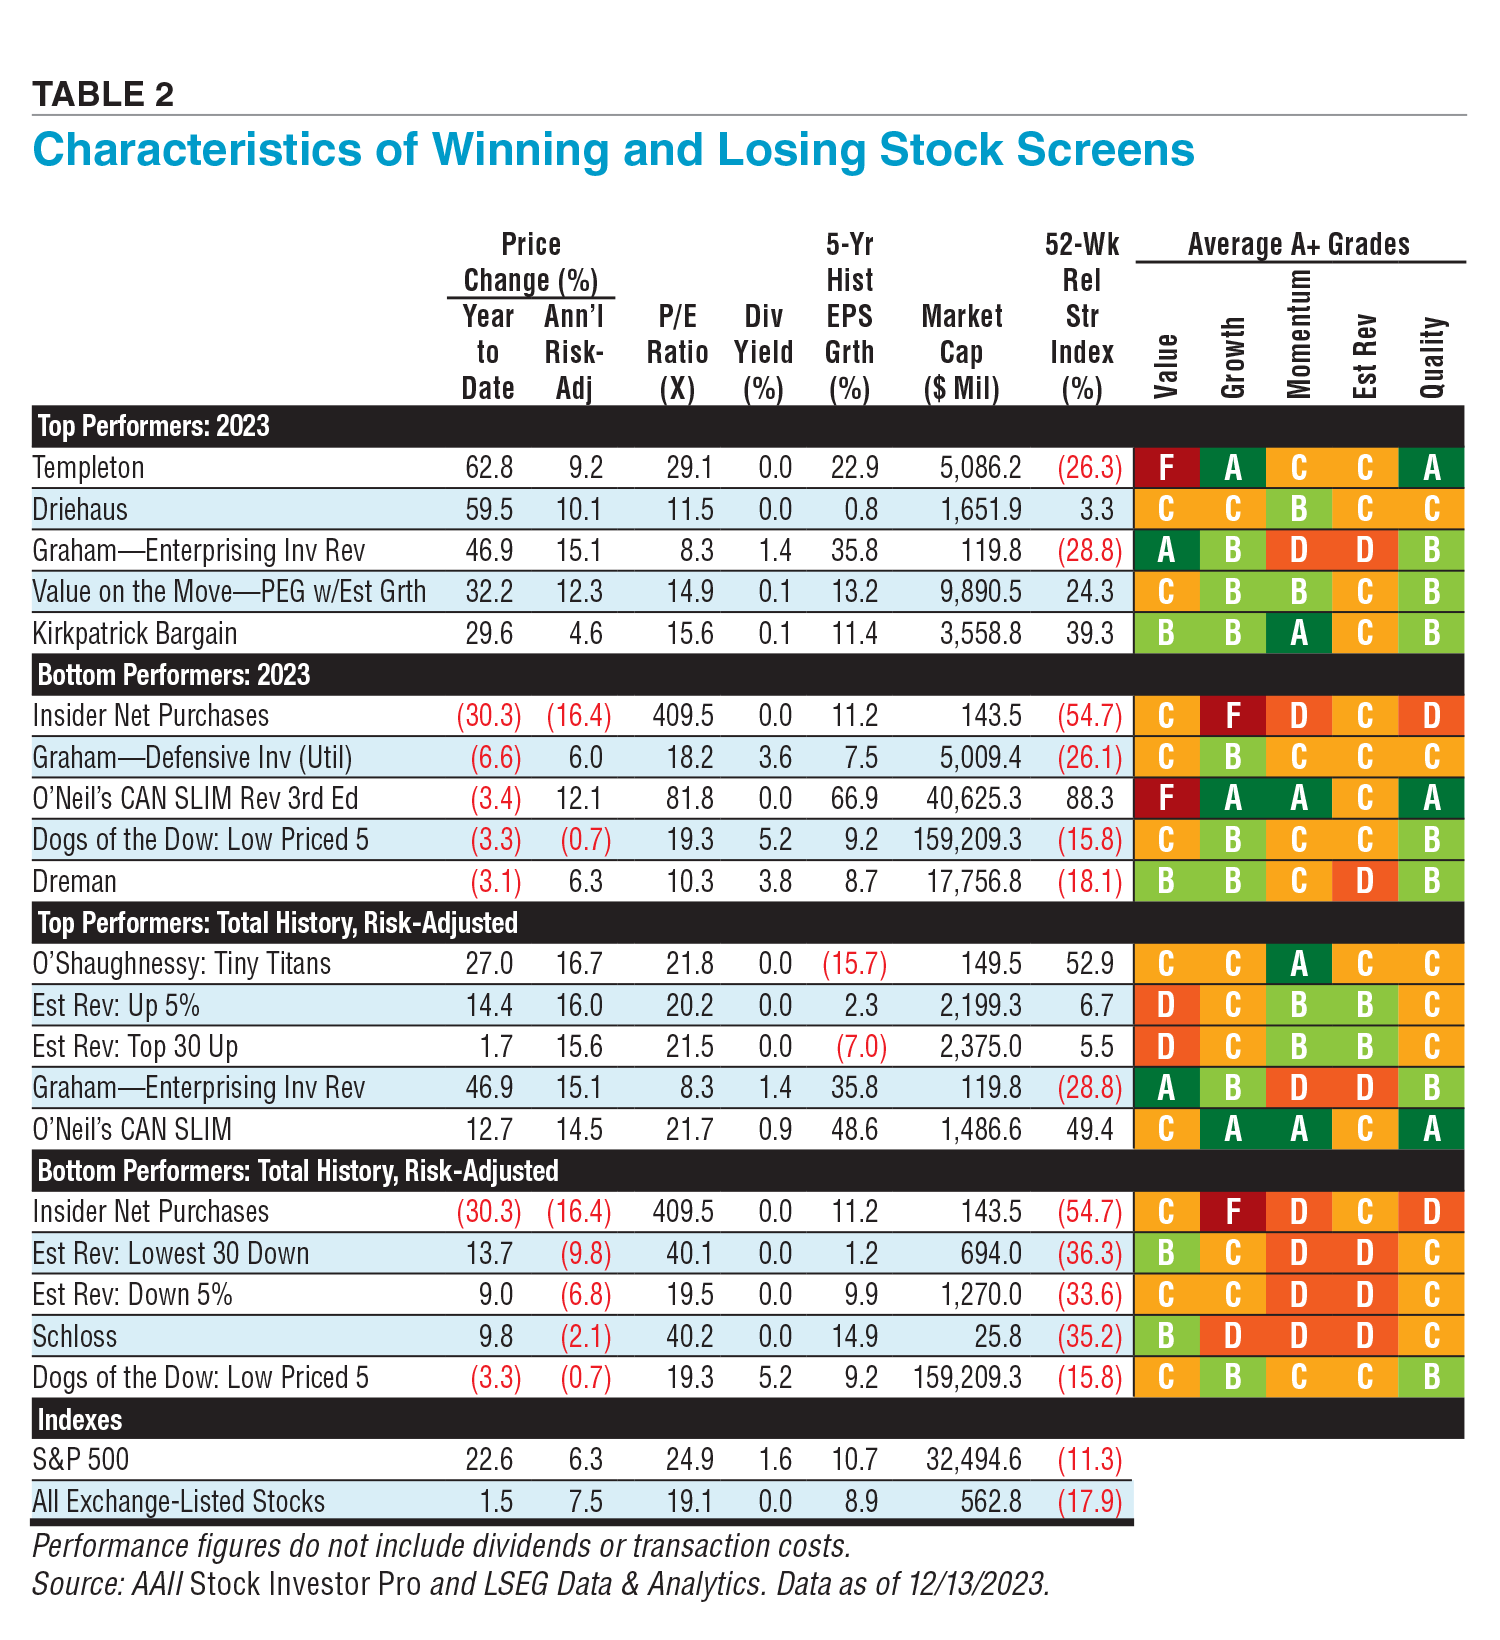
Download the Excel spreadsheet of Table 2.
While the stock market is up this year, the greatest gains have been concentrated in large technology and information services companies. The median year-to-date price gain for exchange-listed stocks is 1.5%. Only 12 of the 55 (22%) screens were able to top the 22.6% price gain of the S&P 500 index this year. In 2022, 33 of the 55 (60%) screens had better performance than that of the S&P 500, which was down 19.4% for the year.
Only the Templeton methodology achieved an all-time-high single-year gain, but 31 (56%) screens outperformed their historical average annual returns.
Market Capitalization
The median market cap (share price times number of shares outstanding) of the stocks that make up the major S&P indexes are:
- S&P 500, $32.5 billion;
- S&P MidCap 400 index, $6.1 billion; and
- S&P SmallCap 600 index, $1.7 billion.
The median market capitalization of the current holdings of the top 2023 performers ranges from the micro-cap holdings of the Graham Enterprising Investor screen to the mid-cap Value on the Move PEG With Estimated Growth screen. These strategies defied the overall trend in the market in 2023, whereby large-cap stocks outperformed mid- and small-cap stocks as measured by the S&P market-cap indexes. However, they were concentrated portfolios often holding less than 10 stocks.
The bottom-performing AAII screens this year were typically larger than the top-performing approaches. The exception is the Insider Net Purchases screen, which excludes companies with market caps above $1.0 billion, based on research that insider buy transactions of smaller and mid-cap companies outperformed similar transactions by insiders of larger-cap companies. Based on the poor short- and long-term returns of the screen, this is one instance where the research did not translate to a successful stock screen.
Value
Looking at the A+ Value Grades and the price-earnings (P/E) ratios (price divided by trailing 12-month earnings per share), the current stocks passing the Templeton screen are more expensive than most stocks. The screen seeks out stocks that are cheaper than their historical norm and does not concern itself with how the passing companies compare against other stocks. This is quite in contrast to stocks passing the Graham Enterprising Investor Revised screen, which have a median price-earnings ratio of 8.3 and an A+ Value Grade of A. This is well below the median price-earnings ratio of 19.1 for all exchange-listed stocks currently in Stock Investor Pro.
The A+ Value Grade examines a variety of value metrics including the price-to-sales (P/S) ratio, price-earnings ratio, the ratio of enterprise value to earnings before interest, taxes, depreciation and amortization (EBITDA), shareholder yield, price-to-book-value (P/B) ratio and price-to-free-cash-flow (P/FCF) ratio. Most of the screens with a value requirement only consider one or two value metrics in their construction.
The Driehaus screen is the only top-performing screen for 2023 that does not have any value filter. It seeks out smaller companies with a strong record of consistent annual earnings increases, positive earnings surprises and strong price momentum. The current stocks passing the filter have an average Value Grade of C.
Generally, the better-performing screens employing valuation filters focus on lower ratios, not the absolute lowest ratios. They also tend to have filters that seek out relative valuations compared to a company’s own historical norm or that of the industry or market.
Growth
The 0.8% median five-year historical earnings growth rate for the current stocks passing the Driehaus screen certainly stands out among the top-performing screens for 2023. The approach seeks out companies with improving year-over-year earnings growth rates over the last four years and simply requires a positive annual growth rate for the latest year. The screen’s focus is on steady improvement instead of high levels of absolute growth.
We have found that simply screening for high levels of historical or expected growth is not typically an effective way to find attractive stock candidates. Investors tend to overpay for high growth, and stock prices suffer as multiples contract when companies end up not being able to live up to the high expectations. Instead, screens that seek out positive but reasonable levels of growth, as well as screens that focus on consistent growth, tend to be more effective.
Momentum
Momentum is based on the price change of a stock over a specified period relative to all other stocks. It is considered to be an anomaly in the analysis of stock returns because stocks with high relative levels of momentum tend to continue to outperform, while stocks with low relative levels of momentum tend to continue underperforming.
The relative strength index figure in Table 2 is calculated against the performance of the iShares Core S&P 500 ETF  (IVV), which is used as a proxy for the S&P 500. Stocks with performance equal to that of the S&P 500 over the last 52 weeks have a relative strength index of zero. A relative strength value of 10.0 indicates that the stock outperformed the S&P 500 by 10.0%. While the A+ Momentum Grade considers performance over the last year, it gives a higher weighting to the most recent quarterly price performance (40%) and grades a stock’s price change relative to all other stocks.
On average, the current holdings in the O’Shaughnessy Tiny Titans screen have outperformed the S&P 500 by 52.9% over the past 52 weeks, and they are in the top 20% of stocks based upon their weighted relative strength. The screen looks for 25 exchange-listed stocks with the highest 52-week relative strength ratio that have a market cap between $25 million and $250 million with a price-to-sales ratio below 1.00.
With the exception of the deep-value Graham Enterprising Investor Revised screen, current stocks passing the filters of the top-performing long-term risk-adjusted screens have higher relative price strength than current holdings of the bottom-performing screens. The Driehaus, Value on the Move PEG With Estimated Growth and Kirkpatrick Bargain screens have price momentum filters.
Estimate Revisions
Screens based on analyst estimates look for revisions in the consensus estimates as well as earnings surprises (actual earnings deviating from the consensus estimate). Academic studies have shown that companies with strong upward earnings revisions or significant earnings surprises can see an impact on share prices for up to one year.
The Driehaus screen is the only top-five 2023 screen to have an earnings surprise requirement; however, the impact of estimate revisions is seen in the long-term performance top and bottom lists. Both of the screens that focus on upward revisions made the top risk-adjusted list, while the downward revisions screens made the long-term bottom-performing list, even as their 2023 performance went against their long-term trends.
Quality
Most of the successful approaches include filters that require minimum levels of financial strength. Screening simply for strong financial strength or quality by itself does not normally identify strong-performing stocks. However, avoiding companies with very weak financial strength generally helps to improve results. Quality filters are normally used as conditioning filters in connection with value, momentum and growth requirements.
Winning Characteristics
When looking at those strategies that have achieved long-term success, several common factors are apparent:
- Low multiples (price-earnings ratio, price-to-book ratio, etc.) on a relative rather than an absolute basis;
- An emphasis on consistency of growth in earnings, sales or dividends;
- Price momentum;
- Upward earnings revisions; and
- Strong financials.
Discussion
FREE REPORT

Don P from USA posted over 2 years ago:
JOHN L from NJ posted over 2 years ago:
G K from IL posted over 2 years ago:
CHARLES R from FL posted over 2 years ago:
Kyle I from CAN posted over 2 years ago:
JAMES D from NY posted over 2 years ago:
You need to log in as a registered AAII user before commenting.
Log InCreate an account