



- Find out where the majority of stock gains came from in 2023
- Learn which AAII screening strategies showed the best performance for the year and over the long term
- See how the stock screens compare on bull and bear market performance, risk and average holdings
Investors witnessed a reversal of fortunes during 2023 compared to 2022, with stocks up for the year. However, it was not a smooth ride and market participation varied widely, with the strongest results concentrated in a relatively small number of stocks and sectors.
Major headlines impacting investors during the year included a regional bank crisis, the frenzy of money pouring into artificial intelligence (AI) investments, OpenAI’s launch of GPT-4, political battles over the debt ceiling, a change in Republican House of Representatives leadership, rising interest rates for much of the year, a recent signal by the Federal Reserve of a pause and possible decline in interest rates next year, the declaration by the U.N. World Health Organization (WHO) of an end to the coronavirus global health emergency, the Hamas invasion of Israel and a broad market rally near the end of the year extending beyond the Magnificent Seven large technology stocks.
Investor sentiment is certainly much more positive now than one year ago. Inflation has come down while economic growth has remained resilient. Fears of a recession did not come true during 2023. Investors are anticipating Fed interest rate cuts, not increases. We have even seen a recent easing in mortgage rates.
We observed a major reversal in trends for popular investment strategies during 2023. Small- and mid-cap value strategies initially led the market until the regional banking crisis developed, with the voluntary liquidation of Silvergate Bank and the failure of Silicon Valley Bank. Market leadership shifted to the Magnificent Seven, and the S&P 500 index’s impressive performance during 2023 is largely attributed to the strong performance of a handful of stocks. The S&P 500 is a market-capitalization-weighted index; therefore, larger companies have a greater impact on its performance.
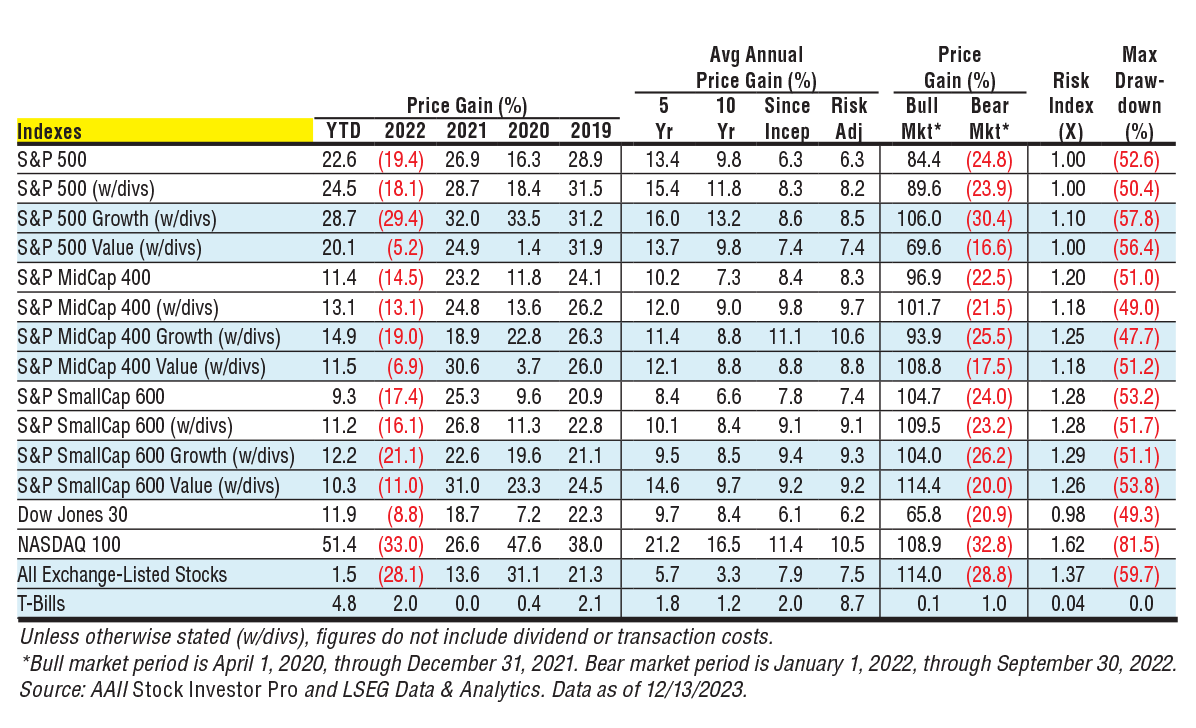
The seven stocks together—Alphabet Inc.  (GOOGL), Amazon.com Inc. (AMZN), Apple Inc. (AAPL), Meta Platforms Inc. (META), Microsoft Corp. (MSFT), Nvidia Corp. (NVDA) and Tesla Inc. (TSLA)—are up 105.4% on average through December 13, 2023, and make up 27.8% of the Vanguard 500 Index fund (VFINX). The S&P 500’s price gain is 22.6% through December 13, while the median price change for all exchange-listed stocks is 1.5%. Even the large-cap, price-weighted Dow Jones industrial average is up only 11.9% for the year.
While the positive stock market gains witnessed during 2023 are certainly a welcome reversal from the losses observed during 2022, the average stock was up only slightly during the year. Stocks in the information technology and communication services sectors had the strongest performance during the year, while utilities, energy, consumer staples and health care sector stocks suffered losses.
2023 Performance of AAII Stock Screens
AAII has been developing, testing, refining and tracking a variety of quantitative stock strategies for over 25 years using Stock Investor Pro, AAII’s fundamental stock screening and research database program. Many of these methodologies follow the approaches of popular investment professionals, known as our “guru” screens. We also present screens based on fundamental financial data known as our “factor” screens. These strategies cover a wide range of investment styles, from those that are value-based to those that focus primarily on price momentum and growth.
This annual recap provides a view into the strongest- and weakest-performing strategies for the past year. It also provides data on previous years and how these strategies performed during up and down markets.
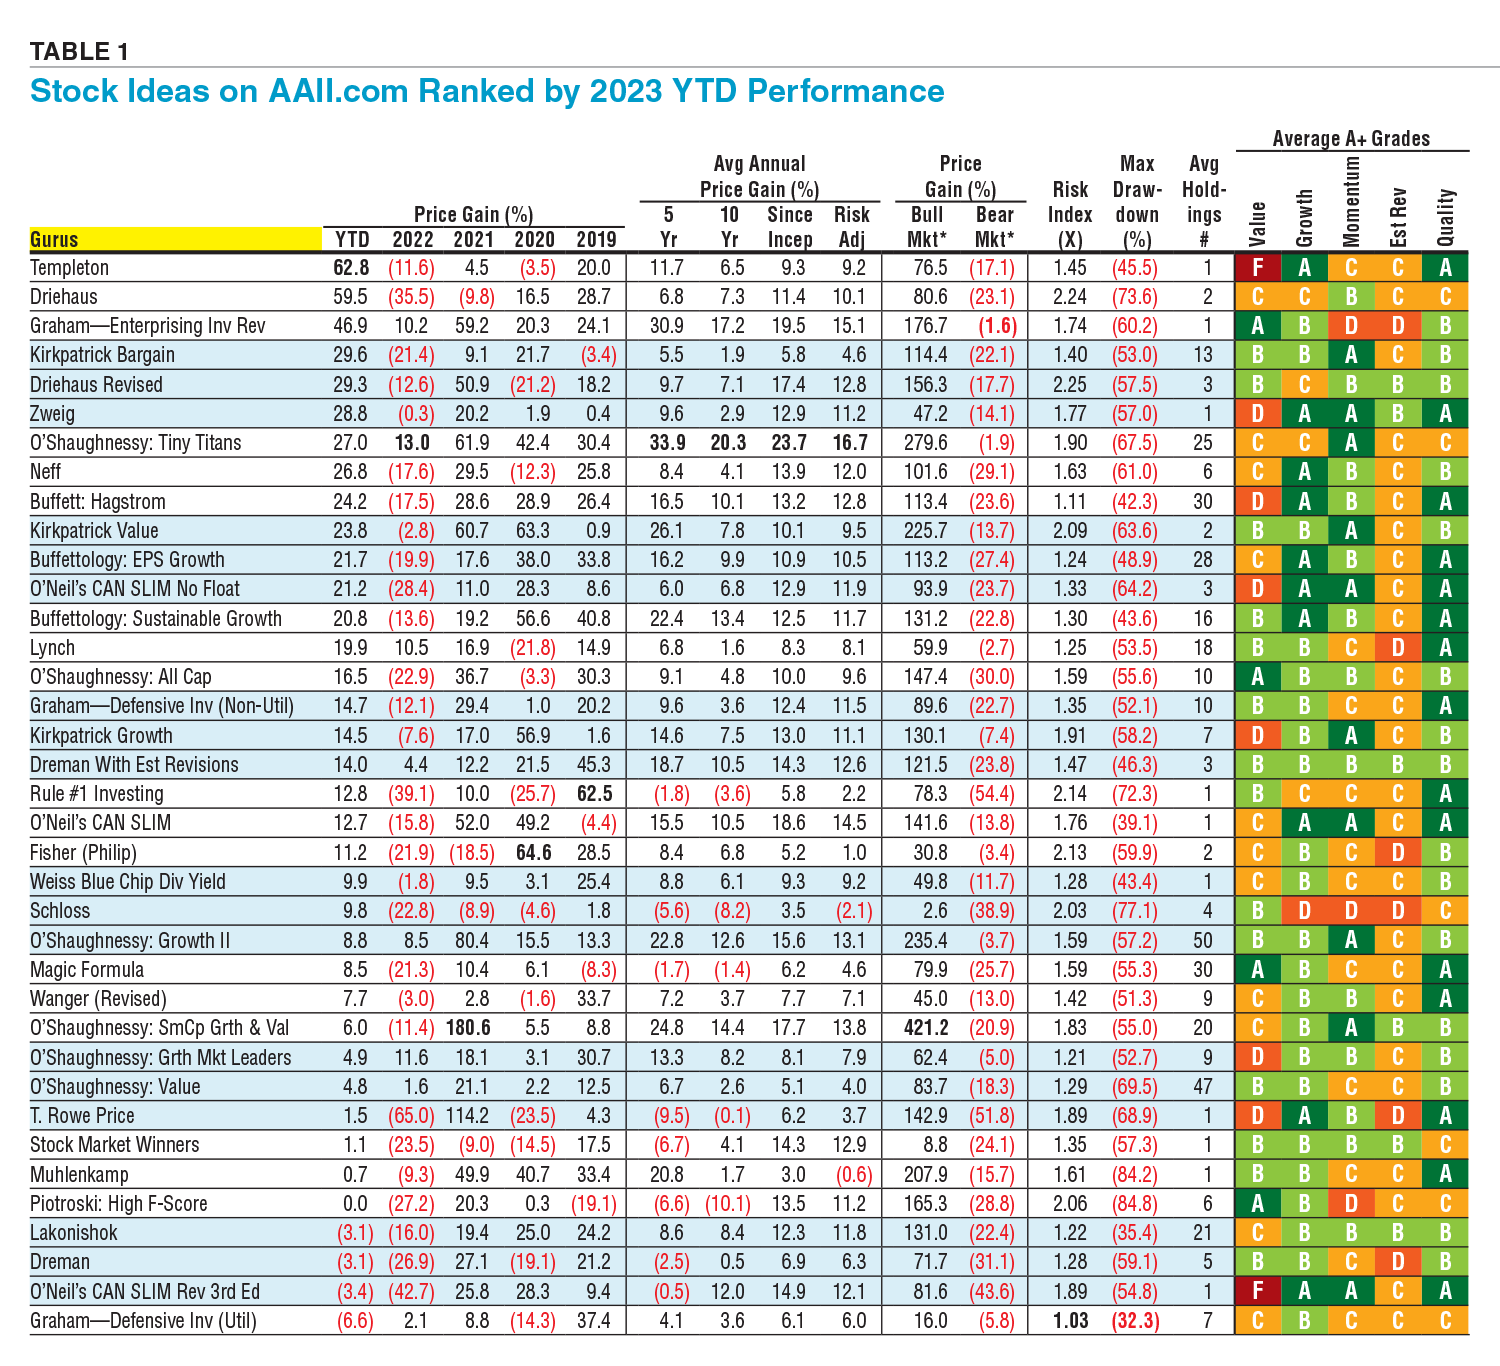
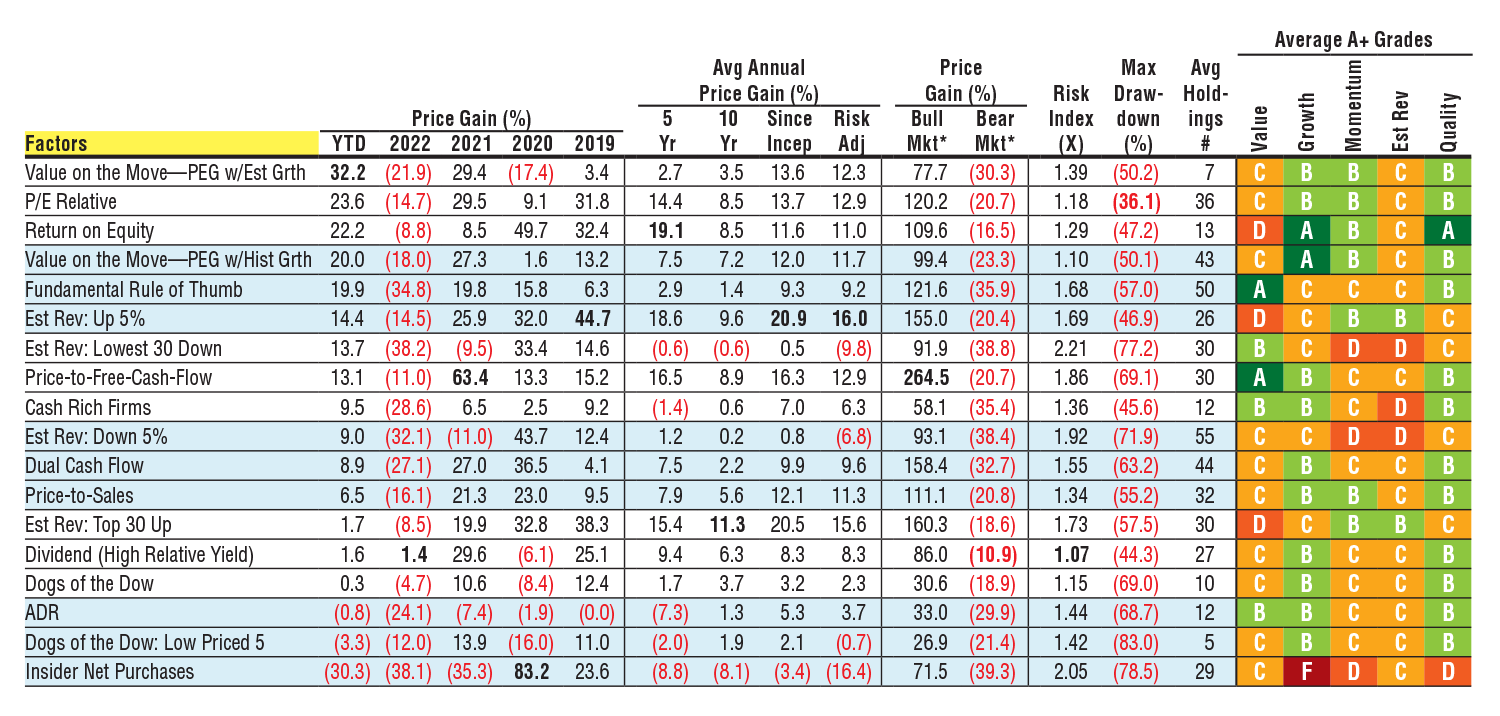
Table 1 summarizes the performance and variability of the screening strategies that AAII tracks, with the guru and factor screens ranked separately in descending order by year-to-date price change through the close on December 13, 2023 (see the AAII Stock Ideas box in this article for more information about how we track and calculate performance). Table 1 presents the price change performance (excluding dividends and transaction costs such as commissions, bid/ask spreads, time and price slippage, etc.) over various periods for each approach. The average A+ Investor Grades for the recent stocks passing these screens helps to understand how passing companies compare to the general domestic market when it comes to valuation, growth, momentum, earnings estimate revisions and surprises, and quality.
The Price Gain and Average Annual Price Gain columns in Table 1 represent the annualized percentage price gain or loss realized by a hypothetical portfolio invested in the stocks passing a given screen over varying periods from January 1, 1998, through December 13, 2023.
Download the Excel spreadsheet of Table 1.
Keep in mind, however, that these figures represent price change only, and do not include dividend payments or dividend reinvestment. Therefore, the results of screens that tend to isolate large, dividend-paying stocks—such as the Weiss Blue Chip Dividend Yield screen—do not receive a boost from dividend payments or reinvestment. The three stocks passing the Weiss Blue Chip Dividend Yield screen are yielding an average of 3.1%. Investors holding shares in these stocks, therefore, would have a higher annual return by approximately this amount for the coming year.
Last year, the AAII Stock Screens reflected the rebound of U.S. stocks as well as the challenge of surpassing the Magnificent Seven–fueled S&P 500. Of the 55 different screening methodologies tracked on AAII.com, 48 were up for the year through December 13. Of the 48 that posted gains year to date, however, only 12 outperformed the S&P 500’s 22.6% price gain through December 13. The median price gain of all AAII Stock Screens was 12.7%, compared to a median price decline of 15.8% in 2022.
Of the 55 stock screening strategies that AAII tracks, most of them have posted gains over the last five- and 10-year periods. Thirteen screens show a loss for their average annualized price gain over the last five years, while seven were in the red over the last 10 years.
Interestingly, 17 of the 55 screening methodologies AAII tracks posted better price returns than the S&P 500 over the last five years, but only 11 posted better results than the S&P 500 over the last 10 years. From inception, 40 of the 55 screens have outperformed the S&P 500.
See “What It Takes: The Fundamental Characteristics of the Top AAII Screens for 2023” in this issue for commonalities between the best and worst screening strategies for the year and over the long term.
For the year through the close on December 13, the top AAII guru strategy is our interpretation of the Templeton approach, up 62.8% for the year. John Templeton studied under Benjamin Graham and developed a contrarian approach to investing. The core concept of the Templeton screen is to identify companies that are priced lower than their historical norm by filtering for companies with a current price-earnings (P/E) ratio below the five-year average ratio. As a measure of quality, the screen requires operating margins above industry norms. For financial strength, the screen requires a ratio of total liabilities to total assets below the industry norm as well. When it comes to earnings growth rates, the Templeton screen requires positive historical growth, positive expected growth and company growth greater than expected for its industry.
See “The Passing Companies Behind the Top Strategy of 2023” in this issue for more on the Templeton approach and a list of the stocks that passed the screen during 2023.
If you find a screen approach interesting, you can favorite the screen by clicking on the star next to its name. Favoriting makes it easy to follow specific screens and get additional insights via the My Screens tool, which is available to all AAII members. The five screens tracked the most by AAII members are: O’Shaughnessy Tiny Titans, O’Shaughnessy Small Cap Growth & Value, Buffettology Sustainable Growth, Buffett Hagstrom and O’Neil CAN SLIM Revised 3rd Edition.
The top AAII factor approach for 2023 is the Value on the Move PEG With Estimated Growth screen. It gained 32.2% through December 13, 2023. The screen seeks out companies with growth at a reasonable price (GARP) that have a record of profitability and strong price momentum over the last 26 weeks. The price-earnings-to-earnings-growth (PEG) ratio, constructed with the consensus earnings growth rate, is the primary screening filter. One popular technique used to seek both value and growth involves finding stocks with low ratios of price-earnings compared to their earnings growth. The PEG ratio is computed by dividing the price-earnings ratio by the earnings growth rate. As a rule of thumb, ratios below 1.00 indicate that a stock may be undervalued, while stocks with ratios above 1.50 may be overvalued. The idea is to purchase a stock with some demonstrated earnings growth before the market recognizes the company’s potential and bids up the price-earnings ratio. There are many variations on this ratio that consider trailing versus expected earnings, historical versus forecasted earnings growth and even whether or not a company pays a dividend.
Market Trends
A range of market indexes are provided in Table 1 to help understand the current and long-term market environment in which these strategies performed. As previously mentioned, growth-oriented strategies performed better this year than value approaches. Large-cap growth was especially strong, as well as the Nasdaq-100 index.
Through the close on December 13, 2023, the S&P 500 Value index posted a total return of 20.1%, while the S&P 500 Growth index had a return of 28.7%.
Within the mid-cap segment, the S&P MidCap 400 Value index has a total return of 11.5% year to date, while the S&P MidCap 400 Growth index is up 14.9%.
The S&P SmallCap 600 Growth index is up 12.2% for the year, while the S&P SmallCap 600 Value index is up 10.3% through December 13, 2023.
In 2022, the technology-heavy Nasdaq-100—which includes the 100 largest nonfinancial companies listed on the Nasdaq stock exchange—lost 33.0%. For 2023, it is up 51.4% year to date as of December 13.
Historical Performance
AAII has performance history for our stock screens dating back to the start of 1998—over 25 years now. The O’Shaughnessy Tiny Titans screen has the best long-term performance with a 23.7% price gain from inception. We developed the screen from James O’Shaughnessy’s book “Predicting the Markets of Tomorrow: A Contrarian Strategy for the Next Twenty Years.” O’Shaughnessy presents several approaches in the book and the Tiny Titans screen is geared toward more aggressive investors searching for cheap micro-cap stocks with upward price momentum. O’Shaughnessy notes that few analysts cover these small stocks, and this lack of coverage leaves room for upside potential when good stocks are largely unnoticed. Additionally, micro-cap stocks have a low correlation with the S&P 500, which is composed mainly of mid- and large-cap stocks. However, O’Shaughnessy warns that these tiny stocks are highly volatile and best suited for investors who can handle the dramatic swings that a portfolio of these stocks will produce. The simple screen filters for small-cap stocks with low price-to-sales (P/S) ratios and strong 52-week relative price strength.
The Estimate Revisions Up 5% screen is the top-performing factor screen from inception with a gain of 20.9%. The Estimate Revisions Up 5% screen has managed to achieve its long-term gains not only by generating strong annual gains but also by not grossly underperforming in its down years; the screen has only had six down years since 1998. The screen looks for upward revisions in annual earnings estimates; specifically, it identifies companies that have had their annual earnings estimates raised by at least 5% over the last month. This and our other earnings estimate revisions screens add these stocks in the month following when the revisions are made to earnings estimates by analysts. In contrast, two of AAII’s worst-performing screens since inception are the Estimate Revisions Lowest 30 Down and Estimate Revisions Down 5% screens, giving credence to the belief that changes in expectations as captured through earnings estimates play a huge factor in the subsequent short-term performance of stocks.
Risk-Adjusted Returns
Table 1 also presents the risk-adjusted return for each of the strategies that AAII tracks. This calculation adjusts the performance of each approach using their volatility as measured through standard deviation of returns, penalizing screens with higher standard deviations (for a more detailed explanation of the risk-adjusted return calculation, see the Calculating Risk-Adjusted Return box below). Using risk-adjusted returns since inception (1998), the three best-performing strategies are O’Shaughnessy Tiny Titans, Estimate Revisions Up 5% and Estimate Revisions Top 30 Up, gaining 16.7%, 16.0% and 15.6%, respectively.
Six of the 55 AAII Stock Screens had negative average annual risk-adjusted returns from inception through 2023, up from five through 2022. On a risk-adjusted basis, the Insider Net Purchases strategy is at the bottom with an average annual risk-adjusted loss of 16.4%.
Calculating Risk-Adjusted Return
The formula for calculating the risk-adjusted return is as follows:
Margin Rate + (Benchmark Std Dev ÷ Portfolio Std Dev) x (Portfolio Return – Margin Rate)
Where:
- Margin Rate = margin rate, the rate at which you borrow funds
- Benchmark Std Dev = standard deviation of the benchmark, in this case the S&P 500 index
- Portfolio Std Dev = standard deviation of the portfolio of stocks passing a given stock screen
- Portfolio Return = return of the portfolio invested in the stocks passing a given stock screen
This calculation assumes that the portfolio return for a given stock screen is higher than the margin rate. If it isn’t, the risk-adjusted return calculation would be as follows:
Margin Rate + (Portfolio Std Dev ÷ Benchmark Std Dev) x (Portfolio Return – Margin Rate)
Following this methodology, we calculate the risk-adjusted returns since inception for all of the AAII Stock Screens.
Bull and Bear Market Results
The majority of stocks have some positive correlation with the overall market: When the market goes up, so do the values of many stocks. By tracking the performance of the stock screens over the latest bull and bear markets, we can see how a strategy performed during an uptrend or its ability to limit losses during a downtrend.
After a long and stable bull market that lasted from 2009 to 2020, we have experienced a rapid succession of bull and bear periods. For our current bull period, we are looking at stock market performance starting on April 1, 2020, and ending on December 31, 2021. Our bear market period encompasses the first nine months of 2022.
The S&P 500 had a price gain of 84.4% during the bull market. The top-performing guru screen was the O’Shaughnessy Small Cap Growth & Value approach, which gained 421.2%, while the best-performing factor screen, the Price-to-Free-Cash-Flow screen, gained 264.5%.
Our O’Shaughnessy Small Cap Growth & Value strategy is similar to the Tiny Titans screen, although it focuses on slightly larger stocks (market cap of $200 million to $2.0 billion versus $25 million to $250 million for Tiny Titans). It seeks out stocks with a price-to-sales ratio below 1.50, adds in a requirement for positive short-term earnings growth and then looks for stocks with strong relative price strength.
The Price-to-Free-Cash-Flow screen is a value-focused approach that looks for companies with a record of positive free cash flow trading with low multiples of free cash flow relative to their industry median and their own historical five-year average.
Over the last bear market, the Graham Enterprising Investor Revised screen had the smallest loss within the guru screens, down 1.6% from January 1, 2022, through September 30, 2022. Within the factor group, the High Relative Dividend Yield screen had the best bear market performance, with a loss of 10.9%. By way of comparison, the S&P 500 gave up 24.8% during the bear market period.
Both approaches require dividend-paying stocks. Dividend payments can provide some price support during down market periods as investors seek out more conservative stocks paying dividends to obtain income.
Another measure of bear market risk is the maximum drawdown experienced by a strategy over its 26-year history. The drawdown is the change from a market high to a market bottom. Within the guru group, the Graham Defensive Investor Utility screen experienced the smallest drawdown of 32.3%. The Piotroski High F-Score screen had the largest drawdown of 84.8%. It would certainly be difficult to stick with an approach if you saw over 80% of your capital lost.
Among the factor screens, the P/E Relative approach had the smallest drawdown of 36.1%, while the Dogs of the Dow Low Priced 5 screen had the largest drawdown of 83.0%.
By way of comparison, the maximum drawdown for the S&P 500 was 52.6%, while the Nasdaq-100 suffered a maximum drawdown of 81.5% over the last 26 years.
Risk Index
The risk index compares the variability of returns for a given stock screening strategy to that of a benchmark. It is calculated by dividing the standard deviation of a strategy’s return by the standard deviation of return for a benchmark, in this case the S&P 500. Standard deviation is a measure of return volatility computed using monthly returns since the beginning of 1998. The risk index provides a relative measure of risk by comparing the variation in return for a screen since the beginning of 1998 to the typical variation in return for the benchmark index. The risk index of the S&P 500, therefore, is 1.00; methodologies with a risk index below 1.00 are below average in risk.
All of AAII’s stock screens have risk indexes above 1.00, which is to be expected. Stock screens, after all, typically have anywhere from a handful of stocks to around 50 that pass their filters, while the S&P 500 is made up of 500 actively traded companies. The Graham Defensive Investor Utility approach has the lowest risk index among the guru screens of 1.03, while the High Relative Dividend Yield screen’s risk index of 1.07 was the lowest among the factor screens. These two screens are made up of “safer” stocks, with one focusing on utility stocks and the other seeking out dividend-paying stocks.
Ranking the 55 stock screens according to risk index, we see that the Driehaus Revised screen and the Driehaus screen have the highest risk indexes of 2.25 and 2.24, respectively. The Estimate Revisions Lowest 30 Down screen has the highest risk index among the factor screens.
Average Holdings
One benefit of quantitative stock screening is the ability to winnow down a universe of stocks to a more manageable number. For stock screens to be useful, however, there ideally should be enough stocks passing to provide various alternatives, but not too many that investors are overloaded with choices.
The average number of passing stocks in the table indicates the average number of stocks passing a filter on a monthly basis. This number can vary depending on the market cycle. The 2023 top-performing Templeton screen has three stocks currently passing the filter and has averaged only one passing stock over the past 25 years.
Conclusion
The stock screening strategies are intended to be an educational resource to show what types of filters and strategies work over varying market conditions. They are not portfolios, nor are they intended to be a buy or recommended list. You should view them as idea generators and analyze the passing stocks further before deciding whether to commit real dollars to them. Furthermore, since market conditions change, it is important to be adequately diversified.
If you decide to follow a specific screen and build a portfolio from it, multiple steps are required in the process. An investor should conduct additional research into a stock to see if it is the right fit for a portfolio. This includes qualitative research such as reading past earnings call transcripts, reviewing management’s guidance and checking any associated news for the company. You may find that a passing company does not constitute a good investment. Quantitative screening is merely the tip of the iceberg when it comes to developing a well-rounded investment strategy. In addition, overall economic conditions may push a strategy out of favor in the short term, so it is important to stay current with trends in the market.
One way to achieve sufficient diversification is to select stocks from multiple stock screening methodologies. However, it is not enough to simply choose those strategies that have the best long-term performance. Instead, it is useful to understand the forces influencing both the overall market and a strategy’s performance and how changing economic conditions can impact both the market and individual stocks. Examining the characteristics of an investment methodology may reveal some practical problems you might face when trying to translate quantitative stock screening into real-world portfolio building..
The AAII Stock Ideas
AAII has been developing, testing and refining a wide range of screening strategies over the years. Many of the screens follow the approaches of popular investment professionals, while others are tied to basic principles of investing. These approaches run the full spectrum, from those that are value-based to those that focus primarily on growth, while most fall somewhere in the middle. Screens following the approach of an investment professional do not represent their actual stock picks. The rules of each screen are defined by our interpretations of their respective investment approaches.
The results of the screening strategies, and the criteria for each screen, are programmed into the Stock Investor Pro program. Passing companies and screening results can also be accessed by all members via AAII.com. The daily screening results are found on the Stocks page of AAII.com. Members can rank the screens using the Screen Power Rankings tool and favorite screens to track passing companies via the My Screens feature. Performance statistics on the screens can be accessed directly via the AAII Stock Screens section within the Stocks menu.
The performance of the stocks passing each screen is tracked on a monthly basis. The month-to-month closing price is used to calculate the return, with equal investments in each stock at the beginning of each month assumed. The impact of factors such as commissions, bid/ask spreads, time slippage (the time between the initial decision to buy a stock and the actual purchase) and taxes is not considered. This overstates the reported performance, but all approaches are subject to the same conditions and procedures. Higher turnover portfolios typically benefit more from these simplified rules. Keep in mind, however, that performance figures for the AAII stock screening strategies represent price change only, and do not include dividend payments or dividend reinvestment. Therefore, the results of screens that tend to isolate large, dividend-paying stocks—such as the Dogs of the Dow (in the factor category)—do not receive a boost from dividend payments or reinvestment.
Sell rules are the same as the buy rules: The hypothetical portfolios are completely reallocated using each subsequent month’s data. Thus, a stock is removed (no longer included in the portfolio) if it ceases to meet the initial criteria, and new stocks are added if they qualify. Note that we use these rules for backtesting purposes but do not necessarily advocate them as part of a real-world investment framework. Stocks that no longer qualify are dropped even if the strategist behind a particular approach suggests different sell rules versus buy rules. This may shorten the holding period and increase the turnover relative to what the strategist would suggest for an actual portfolio.

Related

AAII Stock Ideas
How to Best Use Stock Screens to Build a Portfolio
Related

AAII Stock Ideas
Constructing Winning Stock Screens
Discussion
FREE REPORT

Don P from USA posted over 2 years ago:
MANJUNATH S from CA posted over 2 years ago:
MANJUNATH S from CA posted over 2 years ago:
BARRY J from TX posted over 2 years ago:
BARRY J from TX posted over 2 years ago:
GARY K from TX posted over 2 years ago:
Kyle I from CAN posted over 2 years ago:
You need to log in as a registered AAII user before commenting.
Log InCreate an account