

Related

AAII How-To
Are Your Stocks Overvalued?

Stock Valuation
Making the P/E Ratio More Meaningful

Investor Professor
This First Cut lists the 20 exchange-listed U.S. companies with the lowest current price-earnings relatives compared to their five-year averages.

The price-earnings (P/E) ratio, or earnings multiple, is one of the most widely used measures of stock valuation. Value investors often seek companies with low price-earnings ratios, hoping to identify stocks that are undervalued because of market neglect or an overreaction to negative news.
The price-earnings relative helps investors determine whether a company’s valuation has strayed from its historical relationship with the broader market.
The price-earnings relative is calculated by dividing a company’s price-earnings ratio by the market’s price-earnings ratio. A value of 1.0 indicates that the company and the market trade at the same earnings multiple. Companies with stronger growth prospects are generally expected to command higher price-earnings ratios, resulting in price-earnings relatives above 1.0.
Different market benchmarks can be used to calculate the price-earnings relative. This month’s First Cut uses the median price-earnings ratio of all U.S.-traded stocks, currently 18.8. Comparing a firm’s current price-earnings relative to its five-year average price-earnings relative helps identify stocks trading at unusually low valuations relative to their historical relationship with the market. A stock can appear relatively undervalued even when its price-earnings ratio exceeds that of the market.
This First Cut lists the 20 exchange-listed U.S. companies with the lowest current price-earnings relatives compared to their five-year averages. To help avoid companies facing deteriorating earnings, the screen requires projected earnings-per-share growth in the near term. The table includes annual price-earnings ratios to highlight valuation trends and unusual years that may distort historical averages. Companies must also have a 52-week relative strength rank of at least 50, identifying potentially undervalued stocks with above-average price strength.
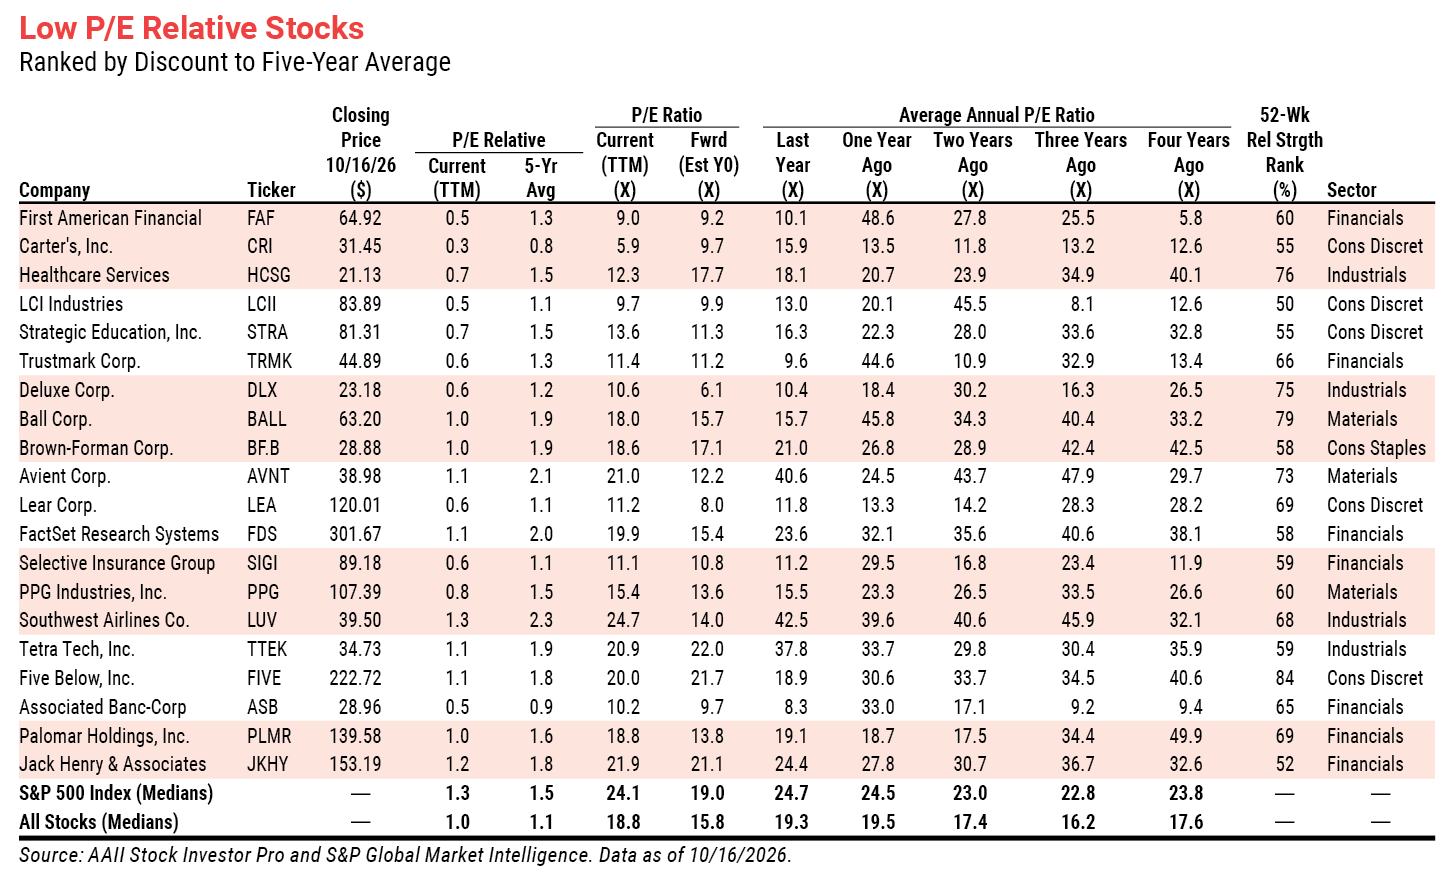
The price-earnings relative approach assumes that a company’s fundamentals and its relationship to the broader market have remained reasonably consistent over time. Investors should evaluate whether a company’s historical price-earnings relative remains an appropriate benchmark for its current and future prospects.
|
|
Field: | Operator: | Factor: | Compare to: |
| Exchange | Not Equal | Over the counter | ||
| And | ADR/ADS Stock | Is | False | |
| And | Price MO60 | > | 0 | |
| And | Country | Contains | United States | |
| And | Price | > | 5 | |
| And | PE-Average Y1 | < | 50 | |
| And | PE-Average Y2 | < | 50 | |
| And | PE-Average Y3 | < | 50 | |
| And | PE-Average Y4 | < | 50 | |
| And | PE-Average YS | < | 50 | |
| And | EPS Est Y0 | > | 0 | |
| And | EPS Est Y1 | > | 0 | |
| And | EPS Est Y1 | > | EPS Est Y0 | |
| And | EPS Est Y0 | > | EPS-Diluted Continuing Y1 | |
| And | % Rank-Rel Strength 52 week | >= | 50 | |
| And | PE Relative Current | < | PE Relative Avg-5 year | |
| Custom Field | ||||
| PE Relative Current | = [PE]/18.8 | Where 18.8 is the current median PE ratio of all stocks in the SI Pro data set* | ||
| *First run the "Statistical Summary - Entire Database" report selecting the *Multiples view to be printed. Note the median PE presented in the Statistical Summary. It was 18.8 at the time we ran the screen. | ||||
AAII How-To
Stock Valuation
Investor Professor

No comments have been added yet. Add your thoughts to the discussion!
You need to log in as a registered AAII user before commenting.
Log InCreate an account