


Charles Rotblut leads a class in AAII's new Essential Investing Video Course. Go to https://www.aaii.com/ves for more information and to subscribe.

Featured Tickers:
- Learn how the major valuation ratios measure a company’s worth and help investors identify potentially undervalued stocks
- Understand the strengths, limitations and applications of each valuation ratio
- Discover why combining valuation measures with consideration of industry differences can provide a more complete assessment of value
A stock’s price is ultimately determined by investors’ assessments of its valuation. While shifts in investor sentiment can cause significant short-term moves, the price does adjust to assessments of the company’s potential for future profitability.
These assessments determine how much investors are willing to pay for the stock based on various financial ratios. Depending on the level of projected growth, the company’s exposure to sector or economic cycles, and perceived risk, higher or lower valuations are assigned.
AAII uses six valuation ratios in the A+ Investor Value Grade. Utilizing more than one ratio allows you to better assess a company’s overall valuation. It also enables you to compare companies across different sectors, since some ratios are more applicable to some industries than others.
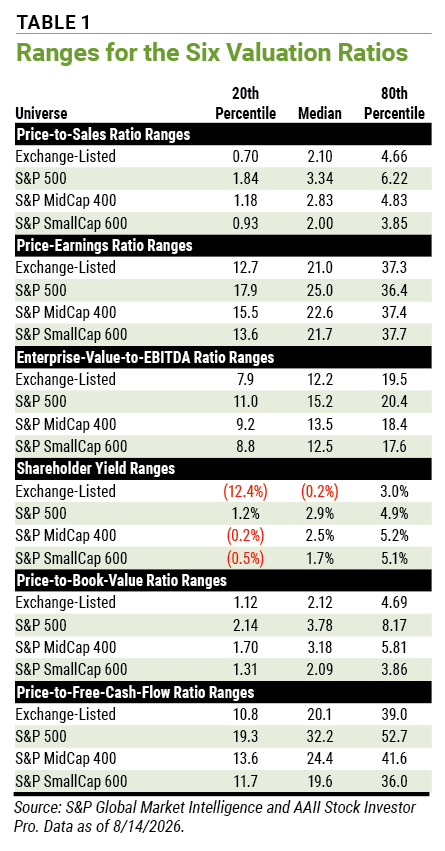
This article explores those six valuation ratios, along with ranges for companies of different sizes (Table 1).
Price-to-Sales Ratio
The price-to-sales (P/S) ratio is calculated by dividing the current stock price by the sales per share for the last four fiscal quarters (trailing 12 months, or TTM).
Proponents of the price-to-sales ratio argue that earnings-based approaches to selecting stocks are inferior because earnings are influenced by management decisions. Sales-based valuations tend to be more consistent than earnings-based valuations. Temporary developments such as costs incurred in a new product rollout or a cyclical slowdown can influence earnings more than sales, often leading to negative earnings. The price-to-sales ratio can provide a meaningful valuation tool when negative earnings render earnings-based models useless.
Price-Earnings Ratio
The price-earnings (P/E) ratio is calculated by dividing the current stock price by diluted earnings per share from continuing operations for the last four quarters (trailing 12 months).
The price-earnings ratio is one of the most popular measures of company value. Analysts and investors follow it closely because it relates the market’s expectation of future company performance—embedded in the price component of the equation—to the company’s reported earnings.
The greater the expectations, the higher the multiple of current earnings investors are willing to pay for the promise of future profits. If the market has low earnings growth expectations or views earnings as suspect, it will not be willing to pay as much per share as it would for a firm with high and more certain earnings growth expectations.
Enterprise-Value-to-EBITDA Ratio
The enterprise-value-to-EBITDA ratio is calculated by dividing enterprise value by earnings before interest, taxes, depreciation and amortization (EBITDA) for the trailing 12 months. Enterprise value is the market capitalization of the company plus debt, minority interest and preferred equity less cash.
A company’s enterprise value represents its economic value, which approximates the total cost of purchasing the company outright before any acquisition premium. Enterprise value considers both the market price of equity and the debt used to generate earnings. Companies with debt must eventually pay it off. This makes the company’s true acquisition cost higher. Adding debt to market cap lowers the enterprise-value-to-EBITDA ratio, making a company less attractive. Excess cash is subtracted from enterprise value because the unneeded cash reduces the overall cost of acquiring a business.
EBITDA ends up serving as an approximation of the firm’s operating cash flow. EBITDA adjusts earnings for factors viewed as secondary to a company’s core operations: interest, depreciation and amortization. It also excludes taxes, which can be influenced by when executives choose to recognize or not recognize certain deductions.
Shareholder Yield
A stock’s shareholder yield is the sum of its buyback yield and dividend yield. It shows what percentage of total cash the company is paying out to shareholders. If a company pays a 1% dividend yield and has a buyback yield of 3%, its shareholder yield will be 4%.
Unlike other valuation measures, shareholder yield is inversely related to value, with higher shareholder yields implying lower valuations.
A stock’s buyback yield is determined by comparing the average number of shares outstanding for the latest fiscal quarter to the average number of shares outstanding in the same fiscal quarter one year ago.
The buyback ratio can be negative if outstanding shares have increased. For example, Chevron Corp.  (CVX) issued new shares as part of its July 2025 acquisition of Hess Corp. Chevron had 1,975.1 million shares outstanding on June 30, 2026. One year prior, on June 30, 2025, the company had 1,724.4 million shares outstanding. Chevron’s buyback yield for this period is therefore:
–14.5% [((1,975.1 ÷ 1,724.4) – 1) x –1].
The dividend yield is calculated by dividing the indicated dividend by the current stock price. The indicated dividend is the cumulative per-share dividend a company expects to pay over the next four quarters. If a company does not pay a dividend, the shareholder yield will equal the buyback yield.
The shareholder yield can be positive or negative. It will be negative if the percentage increase in the company’s outstanding shares is larger than the dividend yield.
Price-to-Book-Value Ratio
The price-to-book-value (P/B) ratio is calculated by dividing the current stock price by book value per share for the latest fiscal quarter.
Book value is generally determined by subtracting total liabilities from total assets and dividing by the number of outstanding shares. It represents the value of the shareholder’s equity based on historical accounting decisions.
The price-to-book ratio provides a relatively stable measure of value, which can be compared to the market (stock) price. Even companies that have negative earnings—and therefore a price-earnings ratio that is not meaningful—often have positive book value. (The price-to-book ratio is not calculated when total liabilities exceed total assets.)
While the market does a good job of valuing securities in the long run, it can overreact to information and push prices away from their true value in the short term. Measures such as the price-to-book ratio help identify which stocks may be undervalued and neglected.
Price-to-Free-Cash-Flow Ratio
The price-to-free-cash-flow (P/FCF) ratio is calculated by dividing the current stock price by free cash flow per share for the last four fiscal quarters. Free cash flow is derived by subtracting capital expenditures (capex) and dividend payments from cash from operations.
Free cash flow is considered the excess cash flow that the company can use as it deems most beneficial. Companies that generate sufficient cash can expand during periods of economic expansion and cover expenses when sales decline during slowdowns.
Both cash from operations and capex are reported on the cash flow statement. The cash flow statement is harder to manipulate through accounting techniques than earnings. Unlike earnings, which are an accounting figure, cash flow represents the net total of cash flowing into and out of the company over a given period.
Which Valuation Ratio Should You Use?
Many investors, both individual and professional, have a preferred valuation ratio. We at AAII have found the price-to-book ratio, which is used in the AAII Model Shadow Stock Portfolio, to be good at identifying undervalued small-cap companies. Other AAII model portfolios use different ratios. The Dividend Investing (DI) model portfolio, for instance, includes shareholder yield in its Dividend Valuation Grade.
Industry and sector considerations also play a role. The price-to-sales ratio is commonly used to value retailers. Precious metal reserves impact the price-to-book ratio of gold and silver miners. The price-to-sales ratio is not useful for banks, since their revenue structure differs from that of most companies.
Using a combination of valuation multiples provides a greater overview of a company’s worth and allows for comparisons across sectors and industries. It also helps to alleviate factors that might impact a single valuation ratio, such as a quarter with depressed earnings that inflates the price-earnings ratio.

Related

Financial Statements
How Financial Statements Drive Stock Valuation Ratios
Related

AAII How-To
Understanding AAII's Revised Value Grade
Discussion
FREE REPORT

Get your free copy of our special
report analyzing the tech stocks
most likely to outperform the
market.
BARRY J from TX posted about 1 month ago:
CHARLES R from IL posted about 1 month ago:
You need to log in as a registered AAII user before commenting.
Log InCreate an account