

Last month, optimism and pessimism in our weekly Sentiment Survey reached unusual levels. Bullish sentiment plunged to 20.9% on December 12, 2018, while bearish sentiment jumped to a multi-year high of 50.3% by the end of December. Of the two, unusually low readings for optimism have a stronger record of being a contrarian indicator.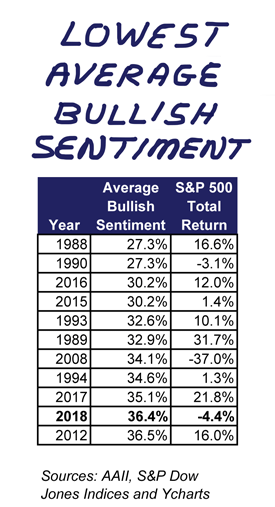
The table displayed below on the web version of this commentary shows the historical performance of the S&P 500 index following the unusual readings for our sentiment measures: bullish, neutral and bearish. As I was updating it, I revisited the annual rankings of average bullish sentiment. Specifically, I looked to see how 2018’s average level of optimism compares to past years.
Last year, bullish sentiment averaged 36.4%. This ranks 2018 as having the 10th lowest level of optimism over the survey’s 31.5-year history. (The survey started in July 1987.) What’s more interesting is the recent trend: 2015, 2016, 2017 and 2018 all rank in the bottom 10 when it comes to average levels of bullish sentiment. Put another way, if we were to split the annual averages into thirds, the last four years would all be placed in the bottom tier in terms of how optimistic AAII members were about the short-term direction of the stock market.
This comparatively lower level of optimism has occurred during a mixed stretch in terms of returns. Double-digit gains were realized in 2016 (12.0% total return for the S&P 500) and in 2017 (21.8%). Dividends kept the total return in positive territory during 2015 (a 1.4% total return). Last year was a tough one, with a loss of 4.4%. Combined, the four-year span realized an annualized return of 7.2%. A below-average gain, but certainly not horrible.
The below-average levels of sentiment fit in with the narrative of the post-financial-crash bull market being unloved. They also highlight the difference between expectations and performance. Five of the 10 years with the lowest average level of bullish sentiment saw double-digit gains for large-cap stocks (1988, 1989, 1993, 2016 and 2017). The S&P 500 was barely positive in 1994 and 2015. It incurred losses in 1990, 2008 and 2018.
We’ve long seen a disconnect between sentiment and allocations. Many AAII members have told us over the years that they follow long-term strategies. While some of you do take tactical steps or otherwise adjust your allocations based on market conditions, it has been our observation that this is not universally the case. There is a difference between expecting tougher market conditions and acting on those feelings.
Many refer to Warren Buffett’s advice of being “fearful when others are greedy and greedy when others are fearful.” Our survey lends support to this guidance. Opportunities to buy stocks arise when many others don’t expect them to do well. While the link between unusual levels of bullish sentiment and market performance is not causal, it can be a useful sign to stop and look at the broader market mosaic. Question whether valuations are high or have been discounted. Check your allocation to see if it is still approximately in line with your goals. Consider whether the talking heads, as a group, are sounding overly optimistic or pessimistic. You may find an opportunity to go bargain-shopping or to anticipate below-median returns for the next six to 12 months.
Table 1. Performance of the AAII Sentiment Survey Without Hindsight
| Bullish | Neutral | Bearish | Bull 8-wk | Bear 8-Wk | B/B Spread | S&P 500 | |
| +1 Standard Deviation above Average, 26-week Returns | |||||||
| Average | 2.7% | 4.9% | 4.4% | 2.6% | 4.9% | 3.4% | 4.5% |
| Median | 3.7% | 5.3% | 5.7% | 3.0% | 6.7% | 3.9% | 5.2% |
| Periods with Gains | 220 | 103 | 198 | 224 | 245 | 192 | 1196 |
| Periods with Losses | 81 | 32 | 100 | 95 | 116 | 66 | 411 |
| Total Count | 301 | 135 | 298 | 319 | 361 | 258 | 1607 |
| Percent Contrarian | 26.9% | 76.3% | 66.4% | 29.8% | 67.9% | 25.6% | |
| Contrarian Movement | Losses | Gains | Gains | Losses | Gains | Losses | |
| -1 Standard Deviation below Average, 26-week Returns | |||||||
| Average | 7.4% | 2.1% | 3.8% | 7.2% | 4.0% | 5.5% | 4.5% |
| Median | 6.9% | 3.1% | 4.2% | 6.6% | 4.5% | 6.5% | 5.2% |
| Periods with Gains | 147 | 240 | 128 | 147 | 130 | 180 | 1196 |
| Periods with Losses | 34 | 145 | 48 | 34 | 50 | 67 | 411 |
| Total Count | 181 | 385 | 176 | 181 | 180 | 247 | 1607 |
| Percent Contrarian | 81.2% | 37.7% | 27.3% | 81.2% | 27.8% | 72.9% | |
| Contrarian Movement | Gains | Losses | Losses | Gains | Losses | Gains | |
| +1 Standard Deviation above Average, 52-week Returns | |||||||
| Average | 5.6% | 11.9% | 7.6% | 5.7% | 8.5% | 6.8% | 9.3% |
| Median | 7.7% | 12.5% | 12.2% | 7.7% | 12.5% | 8.4% | 11.2% |
| Periods with Gains | 217 | 107 | 211 | 233 | 261 | 193 | 1264 |
| Periods with Losses | 81 | 23 | 85 | 80 | 100 | 62 | 317 |
| Total Count | 298 | 130 | 296 | 313 | 361 | 255 | 1581 |
| Percent Contrarian | 27.2% | 82.3% | 71.3% | 25.6% | 72.3% | 24.3% | |
| Contrarian Movement | Losses | Gains | Gains | Losses | Gains | Losses | |
| -1 Standard Deviation below Average, 52-week Returns | |||||||
| Average | 13.3% | 2.9% | 7.4% | 13.5% | 10.6% | 9.4% | 9.3% |
| Median | 16.0% | 7.1% | 8.9% | 15.3% | 11.9% | 15.3% | 11.2% |
| Periods with Gains | 152 | 243 | 130 | 163 | 145 | 189 | 1264 |
| Periods with Losses | 27 | 142 | 44 | 18 | 35 | 56 | 317 |
| Total Count | 179 | 385 | 174 | 181 | 180 | 245 | 1581 |
| Percent Contrarian | 84.9% | 36.9% | 25.3% | 90.1% | 19.4% | 77.1% | |
| Contrarian Movement | Gains | Losses | Losses | Gains | Losses | Gains | |
| Source: AAII Sentiment Survey; Data from June 24, 1987 through December 26, 2018 | |||||||

- Common Mistakes Made When Investing in Quality Companies – In discussing how overconfidence can cause problems, George Washington University professor Lawrence Cunningham wrote, “Straying beyond the boundaries of one’s knowledge and experience increases the risk of error.”
- Biology and Life Experiences Influence Investing Style – Many people are predisposed to one style of investing or another due to their genetics and their life experiences, as this study found.
- The Individual Investor’s Guide to the Top Mutual Funds 2019 – This popular guide helps to compare and contrast 727 funds. Plus, an expanded worksheet gives you detailed data on 1,600 funds.
- Mutual Funds Underperform and Disappear at a High Rate – The overwhelming majority of mutual funds underperform their benchmarks over a 10-year period. Plus, more than half of funds go out of existence within 15 years.
No changes were made to the Model Shadow Stock Portfolio.
Seven of the stocks currently held in the Model Shadow Stock tracking portfolio qualified for purchase: Beazer Homes USA Inc. (BZH), CPI Aerostructures Inc. (CVU), Flexsteel Industries Inc. (FLXS), Hallador Energy Co. (HNRG), New Home Company Inc. (NWHM), Olympic Steel Inc. (ZEUS) and Universal Stainless & Alloy Products (USAP). Qualifying companies are those held in the Model Shadow Stock Portfolio that currently meet the initial purchase rules.
The Model Shadow Stock Portfolio, which is a real-money portfolio of micro-cap value stocks, rose 15.9% during January. By comparison, the portfolio outperformed the S&P 500 large-cap index, which rose 8.0% in January when including dividends (total return). It also outperformed two small-company benchmarks: The Vanguard Small-Cap Index fund (NAESX), which gained 11.8% on a total-return basis, and the DFA U.S. Micro Cap fund (DFSCX), which saw a total-return gain of 10.1% during January.
Since its inception in 1993, the AAII Model Shadow Stock Portfolio has a compound annual average return of 14.6% versus the Vanguard 500 Index fund’s (VFINX) gain of 9.2% per year on average over the same period. Over the same period, the Vanguard Small Cap Index fund (NAESX) posted an average annual gain of 9.9%.
Earnings season will begin to shift toward the retailers. Thirty-two S&P 500 companies are scheduled to report, including Dow Jones industrial average component Home Depot Inc. (HD) on Tuesday.
The week’s first economic reports will be December housing starts and building permits, the December Case-Shiller home price index and the Conference Board’s February consumer confidence survey, all of which will be released on Tuesday. Wednesday will feature December international trade, December factory orders and January pending home sales. Preliminary fourth-quarter GDP and the February Chicago Purchasing Managers’ Index (PMI) will be released on Thursday. Friday will feature December personal income and spending, the February PMI manufacturing index, the February Institute for Supply Management (ISM) manufacturing index and the University of Michigan’s final February consumer sentiment survey results.
Federal Reserve chair Jerome Powell will give his semiannual testimony to Congress on Tuesday and Wednesday. Other Fed officials making public appearances are Philadelphia president Patrick Harker and vice chairman Richard Clarida on Thursday and Atlanta president Raphael Bostic on Thursday and Friday.
The Treasury Department will auction $40 billion in two-year notes and $41 billion in five-year notes on Monday and $32 billion in seven-year notes on Tuesday.
- The Individual Investor’s Guide to the Top Mutual Funds 2019
- Reduce Stock Exposure in Retirement, or Gradually Increase It?
- The Cash Flow Statement: Tracing the Sources and Uses of Cash

February 14, 2019 Your Returns May Be Anything but Average
February 7, 2019 Some Perspective on Buybacks Given Recent Criticism
January 31, 2019 How to Invest Differently Than a Mutual Fund
January 24, 2019 AAII Members Share Their Memories of John Bogle

