

Buybacks have been put back into the spotlight as boogeymen. Earlier this week, Senators Chuck Schumer and Bernie Sanders wrote an op-ed in The New York Times attacking share repurchases. Among their accusations were that stock buybacks mostly benefit the wealthy and divert money from being spent on capital expenditures, salary increases and other worker benefits.
It’s not the first time buybacks have been criticized and I doubt it will be the last. Making buybacks a scapegoat is an easy sound bite to score political points with. The reality about share repurchases is more complicated; as such, I’m going to provide some perspective.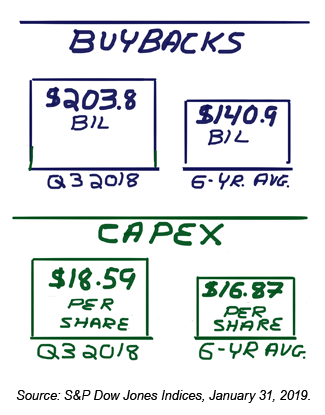
If you invest in stocks, you should prefer companies with either falling counts of shares outstanding or at least no increase in the number of shares outstanding, all other things being equal. Such stocks have outperformed by a big margin, with annualized gains of 17.5% and 16.6% based on data from Dartmouth professor Kenneth French’s data library for the period of 1964 through 2018. You also want to avoid the companies with the largest increases in share counts; such companies have annualized returns of just 4.4%.
If you invest in stocks, you have some wealth. At least enough wealth to set aside money for a period of time before it needs to be spent. While the affluent own more stocks, anyone who invests in the stock market benefits when share prices rise. Thus, attacking buybacks because it makes the affluent wealthier is misplaced criticism. Yes, the person with a $2 million or $20 million portfolio realizes a greater increase in wealth, but those with equity exposure of $2,000 or $20,000 also benefit when buybacks boost share prices.
The benefit from stock repurchases is indirect. A direct benefit would be receiving cash because you sold your shares to the company conducting the repurchase program. When buybacks occur on the open market, the odds of you or me directly selling to the company are very slim. The most likely occurrence is us selling our shares to another investor. What does happen is that our ownership interest increases relative to the reduction in the number of shares outstanding. Put differently, our slice of the ownership pie gets a little bigger. Additionally, since there are fewer shares outstanding, the laws of supply and demand work in our favor.
Share repurchases do require an outflow of cash from corporations. Critics of buybacks argue such dollars should be spent elsewhere. Data from S&P Dow Jones Indices shows S&P 500 index companies spending a record $203.76 billion in the third quarter of 2018 versus a six-year average of $140.88 billion. Dollars spent on buybacks soared following the passage of the Tax Cuts and Jobs Act due to the combination of tax savings and repatriation. S&P 500 companies also spent $18.59 per share on capital expenditures (capex) during the third quarter. This compares to six-year average capex of $16.87 per share. On a rolling four-quarter basis, capital expenditures per share are also at a six-year high. So, S&P 500 companies are reinvesting in themselves in addition to buying back stock.
While many cheer capital spending for its economic benefit, too much capex isn’t a good thing. French’s data shows companies with the lowest proportionate year-over-year growth realizing an annualized return of 16.8% over the past 55 years. Stocks of companies with the highest growth in assets mustered just a 6.5% annualized return.
None of this addresses the issue of wage growth. No CEO is going to say on a conference call that they need to cap salaries to keep buying back stock or raise the dividend. This doesn’t mean the cause of disappointing wage growth is buybacks (or growing dividends). The reality is more complex, as there are several other factors at play (e.g., expected business conditions, the stickiness of wages, pressures to maintain margins, structural issues, etc.). Just as the new tax bill has not led to the stronger pace of wage growth its proponents claimed it would, neither should the proposed legislation on buybacks be expected to necessarily do so.

- Stock Buybacks: Misunderstood, Misanalyzed and Misdiagnosed – For another view of buybacks, I suggest reading this 2015 AAII Journal article by New York University professor Aswath Damodaran.
- The Cash Flow Statement: Tracing the Sources and Uses of Cash – If you want to see how a company is spending its cash, look at the cash flow statement. This primer will help familiarize you with it.
- The Individual Investor’s Guide to the Top Mutual Funds 2019 – This popular guide helps to compare and contrast 727 funds. Plus, an expanded worksheet gives you detailed data on more than 1,600 funds.
- Majority of Retirees Regret Not Saving More for Retirement – Many retirees say they wish they had saved more for retirement, with more than a third retiring earlier than planned.
It’s going to be another busy week for earnings, with many smaller companies reporting in addition to the more than 60 S&P 500 companies on the calendar. Included in the group are Dow Jones industrial average components Cisco Systems Inc. (CSCO) on Wednesday and Coca-Cola Co. (KO) on Thursday.
The week’s first economic report will be the December JOLTS report, released on Tuesday. Wednesday will feature the January consumer price index (CPI). The January producer price index (PPI), January retail sales and November business inventories will be released on Thursday. Friday will feature the February Empire State manufacturing survey, January import and export prices, January industrial production and capacity utilization and the University of Michigan’s preliminary February consumer sentiment survey.
Three Federal Reserve officials will make public appearances: Kansas City president Ester George on Tuesday, Cleveland president Loretta Mester on Tuesday and Wednesday and Atlanta president Raphael Bostic on Wednesday and Friday.
- The Individual Investor’s Guide to the Top Mutual Funds 2019
- The Individual Investor’s Guide to Personal Tax Planning 2018
- Beyond the Index Card: Implementing the Advice of the Financial Experts
Optimism about the short-term direction of stock prices jumped to a three-month high in the latest AAII Sentiment Survey. Neutral sentiment also rose, while pessimism plunged.
Bullish sentiment, expectations that stock prices will rise over the next six months, rose 8.1 percentage points to 39.9%. Optimism was last higher on November 7, 2018 (41.3%). This is just the fourth time in five months that bullish sentiment is at or above its historical average of 38.5%.
Neutral sentiment, expectations that stock prices will stay essentially unchanged over the next six months, rose 0.9 percentage points to 37.3%. Neutral sentiment was last higher on August 1, 2018 (38.8%). The historical average is 31.0%.
Bearish sentiment, expectations that stock prices will fall over the next six months, fell 9.0 percentage points to 22.8%. Pessimism was last lower on June 13, 2018 (21.7%). This is just the third time bearish sentiment is below its historical average of 30.5% during the past five months.
At current levels, all three sentiment indicators are within their typical historical ranges though pessimism is near the lower end of its range.
Even with this week’s big rise, optimism is close to its historical average. While the rebound in stock prices is encouraging some individual investors, others have concerns about its sustainability. Many individual investors are monitoring trade negotiations. Also having an influence are Washington politics (including President Trump and Democratic control of the House of Representatives), corporate earnings, the Federal Reserve, valuations and concerns about the pace of economic growth.
This week’s special question asked AAII members for their thoughts on the prospect of the Federal Reserve pausing its cycle of raising interest rates. Nearly two-thirds of the respondents (65%) agree with the neutral stance. Many of these respondents pointed to the lack of inflationary pressures, approve of chairman Jerome Powell’s talk of being data dependent or noted current uncertainties over trade. Others said that while they agree with the current pause, further rate hikes are still warranted. Slightly more than 18% express concern, viewing the Fed as being influenced by the stock market and/or President Trump or otherwise believing rates need to be raised further. About 6% say they are comfortable with monetary policy so long as it is based on the economic data.
Here is a sampling of the responses:
- “It is an excellent idea since there is no sign of inflation heating up.”
- “I wish rates were higher, but their data-dependent approach is better for now.”
- “I think they are nervous about the political tongue lashing, even though they say otherwise.”
- “Some raising may be necessary if only to provide flexibility to maneuver when the next financial crisis occurs.”
- “I think they are pausing for certain things to play out and to get more data.”

Bullish: 39.9%, up 8.1 points
Neutral: 37.3%, up 0.9 points
Bearish: 22.8%, down 9.0 points
Bullish: 38.5%
Neutral: 31.0%
Bearish: 30.5%
AAII Asset Allocation Survey
Equity allocations among individual investors jumped to their highest level in a year in January. The latest AAII Asset Allocation Survey also shows a big pullback in cash allocations and a small decrease in fixed-income exposure.
Stock and stock fund allocations rebounded by 8.8 percentage points to 71.2%. Exposure to equities was last at this level in January 2018. Equity allocations are above their historical average of 61.0% for the 70th consecutive month.
Bond and bond fund allocations declined 0.3 percentage points to 15.5%. The small decrease keeps exposure to fixed-income below the historical average of 16.0% for the 14th consecutive month.
Cash allocations plunged by 8.4 percentage points to 13.3%. Cash levels were last this low in January 2018. The drop keeps cash allocations below their historical average of 23.0% for the 86th consecutive month.
The large increase in equity allocations occurred as the stock market rebounded strongly from its December lows. At the same time, cash exposure dropped from what had been nearly a six-month high. Differences in which AAII members participated in December’s and January’s surveys may have also impacted the results.
Last month’s special question asked AAII members what allocation changes they expect to make this year. Responses were mixed. Almost one out of three respondents (32%) do not plan to make any change or will simply rebalance their portfolios as needed. Slightly more than 19% intend to increase the amount of cash they hold, many in anticipation of hoping to buy stocks at a lower price. About 14% intend to boost their allocation to equities while a little under 14% say they will add more bonds or bond funds. Approximately 8% say they will hold more income-producing securities, be they dividend stocks, bonds or real-estate investment trusts (REITs). Several respondents say their intentions are dependent on how the stock market performs or what happens with interest rates.
Here is a sampling of the responses:
- “I hope to increase my percentage allocation to bonds.”
- “I am sensing a bear market and am beginning to reduce my equity holdings and put more into bonds.”
- “Increased my cash position as I expect the equity market to be down by the end of the year.”
- “Depends on the market; hopefully less cash.”
- “More cash into stocks. Buying on opportunities for long-term holdings.”
- Stocks and stock funds: 71.2%, up 8.8 percentage points
- Bonds and bond funds: 15.5%, down 0.3 percentage points
- Cash: 13.3%, down 8.4 percentage points
- Stocks: 33.3%, up 5.4 percentage points
- Stock Funds: 38.0%, 3.4 percentage points
- Bonds: 3.2%, down 1.1 percentage points
- Bond Funds: 12.3%, up 0.7 percentage points
Take the Asset Allocation Survey.
Local Chapter Meetings

January 31, 2019 How to Invest Differently Than a Mutual Fund
January 24, 2019 AAII Members Share Their Memories of John Bogle
January 17, 2019 A Few Personal Thoughts in Remembrance of John Bogle
January 10, 2019 Brokers Announce New Stock Exchange: What We Know

