

Charles Rotblut leads a class in AAII's new Essential Investing Video Course. Go to https://www.aaii.com/ves for more information and to subscribe.

- Guide to quickly analyzing earnings reports for trends, surprises and financial health
- Key indicators to focus on include revenue, margins, guidance and cash flow
- AAII.com tools and resources to streamline analysis and support long-term investing decisions
The headlines surrounding earnings reports often focus on whether a company beat, missed or matched analysts’ expectations. Some headlines will focus on revenues or forward guidance.
Much information is left out. If you only focus on the headlines, you will miss out on identifying key trends affecting the company. You will also miss out on important context regarding the underlying business and how it affects performance.
Conducting an analysis of earnings reports from the companies you own shares in or are watching will make you a more informed investor. It will also help you form a better opinion of whether you should continue to hold a stock in your portfolio or if the time to sell is nearing.
This analysis does not need to be complicated. An informed investor with a good process can form an objective opinion in a short amount of time by knowing what to look for. In this installment of our financial statement analysis series, we show you how to effectively analyze earnings reports.
When to Expect Earnings Reports
U.S. companies are required to report earnings quarterly. The majority of companies operate on a calendar-year fiscal year (January through December). They release earnings during the following months:
- Fourth Quarter: January/early February
- First Quarter: April/early May
- Second Quarter: July/early August
- Third Quarter: October/early November
Retailers mostly operate on a February through January fiscal year, meaning their earnings reports come out in February, May, August and November. A small percentage of companies operate on nontraditional fiscal-year periods. Nike Inc.  (NKE) and Adobe Inc. (ADBE), for instance, report earnings in March, June, September and December.
Because companies announce earnings around the same time each year, it is easy to anticipate when a company will report next. Press releases announcing the specific earnings release date are distributed prior to the actual earnings announcement.
Preparation Before Reading a Report
If you’ve owned or followed a company for a while, you probably have a good idea of what its key drivers and headwinds are. It can still be helpful to review the previous quarter’s results and any guidance the company had provided.
Check the consensus earnings estimate for the period being reported. This number is the average of all estimates by covering brokerage analysts who make their forecasts available to S&P Global and other data companies.
Reviewing the trend in earnings estimate revisions can also help you set expectations. Upward revisions imply that analysts expect earnings to be better than previously thought. Downward revisions suggest earnings may be worse than previously expected. Minor adjustments are common; sizeable adjustments are more telling.
A Five-Step Framework for Analyzing Earnings Reports
Earnings releases can be accessed directly on a company’s investor relations website. They are also commonly distributed via press release services like Businesswire and PR Newswire.
Once earnings are released, you can use this five-step process to analyze them.
Step 1: Check Earnings and Other Key Financial Data
The earnings release contains the data that initially drives stock price reactions once earnings are announced.
Start with the obvious numbers: revenue, net income and earnings per share. Check to see if earnings per share—specifically, adjusted (aka operating or non-GAAP) earnings, if used—are better or worse than analysts’ expectations.
Earnings within +/–2% of the consensus estimate are considered to be in line with analyst expectations. Earnings topping expectations by at least 2% are positive surprises. Earnings missing expectations by at least 2% are negative surprises.
After reviewing the latest results, scan through the income statement (Figure 1), the balance sheet and, if provided, the cash flow statement. Compare the current quarter’s numbers to those of the prior-year quarter. Look for unusual changes given the revenues reported. Growth in inventory and accounts payable isn’t unusual when revenues are growing. Falling revenues and rising inventory deserve more investigation.
FIGURE 1
Highlights From Home Depot’s Income Statement
The income statement below was included by Home Depot Inc. (HD) in its earnings press release for the first quarter of its fiscal-year 2025, which ended on May 4. With a quick glance, we can tell that the home improvement retailer grew revenues and kept gross margins roughly stable relative to the same quarter one year prior. Operating margins decreased due to a disproportionate increase in selling, general and administrative (SG&A) expenses. Narrower operating margins and higher interest expense led to lower earnings.
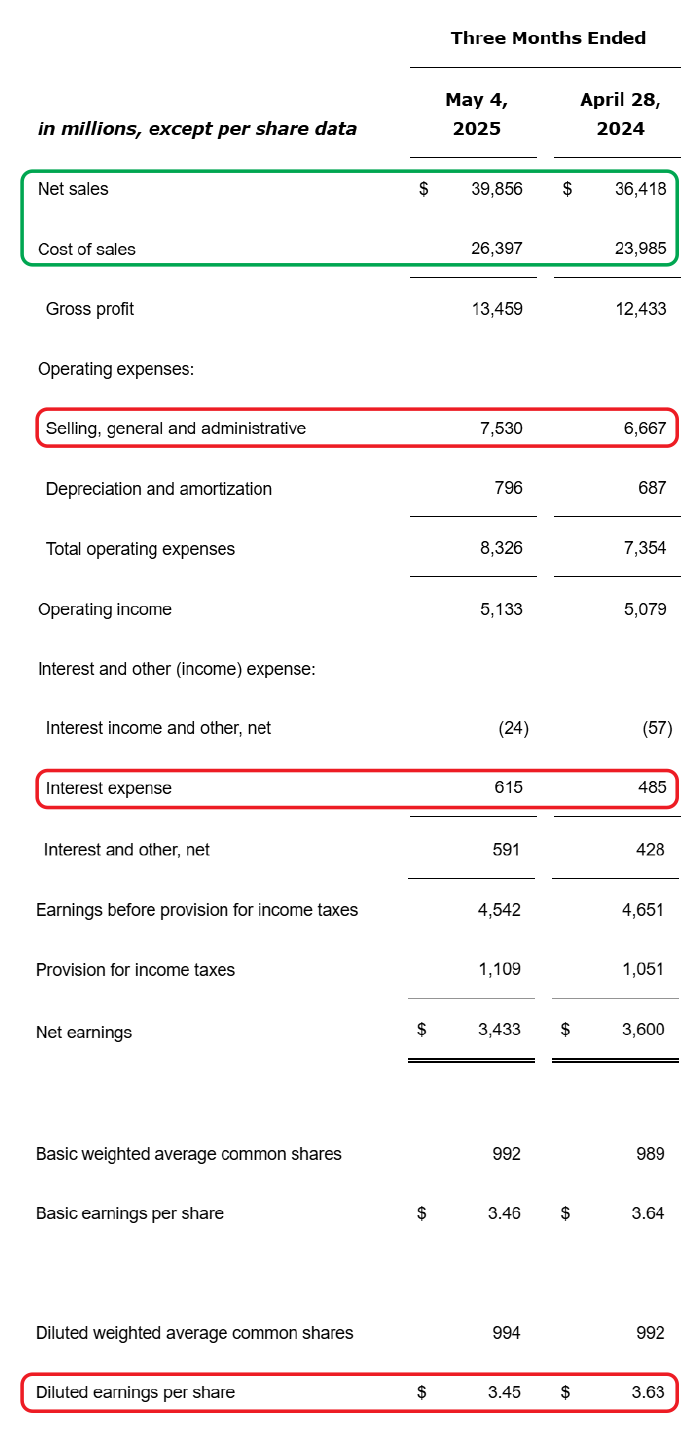
Source: Home Depot Inc. Data as of 5/20/2025.
Pay attention to profit trends. Expanding margins often signal improving operational efficiency or pricing power, while contracting margins may indicate competitive pressure or rising costs. Management’s commentary in the earnings release or during the conference call should explain any notable changes in margins.
For dividend-paying companies, note any changes to the quarterly dividend payment. Compare the latest dividend increase to past increases to understand if the company is maintaining, accelerating or slowing its dividend growth trajectory.
Step 2: Evaluate Earnings Surprises and the Company’s Forward Guidance
Compare the reported earnings against the consensus estimate. Did they beat, miss or fall in line with analyst expectations? Note the 2% rule mentioned above.
Many companies provide updated revenue and earnings guidance with their reports, giving investors a feel for what management currently expects. Full-year guidance for the current or next year is most common, though some companies provide guidance for the new quarter as well.
When full-year guidance is provided, compare it to the guidance given during the previous quarters. This can require revisiting the previous quarter’s earnings release. Look for any changes in management’s forecast.
Upward revisions to guidance are preferred. Downward revisions should be explained by the company. Short-term issues like weather can be a factor, but executives can cite external factors to downplay company-specific issues.
Monitor how analysts change their earnings estimates in the days following the earnings announcement. AAII members can track these changes on the Snapshot tab of a company’s AAII Stock Evaluator page (Figure 2). Positive (upward) revisions are preferred. Drops in the consensus estimate beyond the range of any downwardly revised guidance given by the company is concerning.
FIGURE 2
Earnings Estimates for Home Depot
This snapshot from the AAII Stock Evaluator shows that analysts have largely left their expectations for Home Depot Inc.’s (HD) current fiscal year unchanged following the earnings release for the fiscal first-quarter 2025 ended May 4. (Minor positive or negative revisions are not meaningful.) In the release, the company reaffirmed its revenue and earnings guidance for fiscal-year 2025 ending in January.
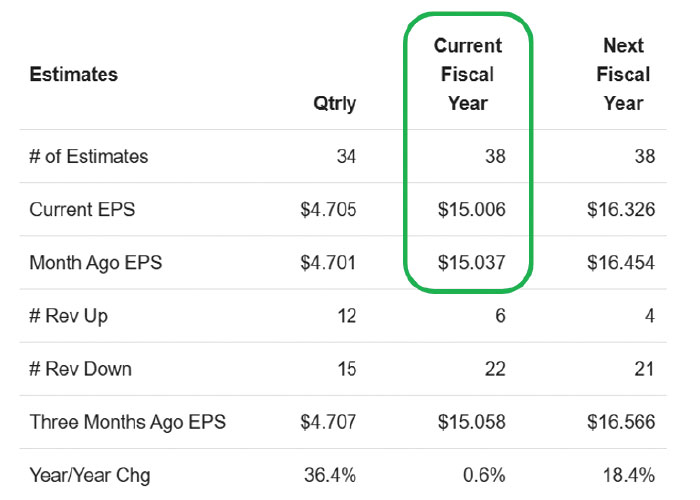
Source: AAII and S&P Global Market Intelligence. Data as of 6/11/2025.
Step 3: Review the Earnings Presentation for Additional Insights
Most companies provide earnings conference call presentation slides in the investor relations section of their website. The slides often contain additional information about business segment performance, industry trends and management’s strategic priorities.
Focus on slides that break down performance by business segment. This granular data helps you understand which parts of the business are driving overall results and identify potential areas of strength or concern.
Pay attention to any updated strategic initiatives or capital allocation priorities. Changes in research and development (R&D) spending, capital expenditure (capex) plans or acquisition strategies can signal shifts in management’s long-term outlook for the business.
Step 4: Examine the Earnings Call Transcript
Companies host a conference call with analysts following the release of earnings. These calls provide commentary by the company’s executives, followed by a Q&A session with analysts. You can listen live, access recordings on the company’s investor relations website or read the transcript. Transcripts are available on websites such as Seeking Alpha.
Look or listen for any information of significant importance. This can include color on the key drivers of current or future business conditions, explanations of any notable changes in financial statements (profit margin changes, increases in debt, etc.) and management’s forward guidance. It is also helpful to pay attention to any mentions of customer behavior changes, competitive dynamics or regulatory developments that could affect future performance.
Analysts frequently ask questions related to their own financial models. More telling is when they ask a company’s executives to provide more detail on recent financial performance or forward guidance. This includes margin pressures, shifts in customer demand and inventory changes. Pay particular attention when analysts appear to be challenging management’s outlook.
Step 5: Review SEC Filings (Forms 10-Q and 10-K) for Additional Insights
These reports should be filed on time with the U.S. Securities and Exchange Commission (SEC). A delayed filing is a cause for concern.
The Form 10-Q or Form 10-K filings provide the most comprehensive financial information and typically become available within a few days of the earnings announcement. While these documents can be lengthy, focus on specific sections that provide insights beyond the earnings release.
Review the notes to the financial statements for detailed explanations of any significant changes in balance sheet or income statement items. These notes often explain the business rationale behind changes in inventory levels, accounts receivable or debt arrangements.
Going Deeper: Assessing a Company’s Financial Health
For an even deeper dive, integrate the key financial ratios and red flag indicators discussed in two previous articles in our financial statement analysis series: “18 Financial Ratios That Shed Light on a Company’s Strengths and Weaknesses” in the January 2025 AAII Journal, and “16 Red Flags to Watch for in a Company’s Financial Statements” in the May 2025 AAII Journal.
Review liquidity ratios like the current ratio to ensure the company can meet its short-term obligations. A current ratio below 1.0 may signal financial stress.
Examine cash flow trends. When net income consistently exceeds operating cash flow, it raises questions about earnings quality and sustainability.
Review key profitability ratios including return on assets (ROA), return on equity (ROE) and various margin metrics.
Pay special attention to debt-related metrics. Rising debt levels without corresponding revenue growth, or interest coverage ratios approaching 1.0, can indicate potential solvency issues.
Putting It All Together: Key Takeaways From Earnings Reports
After completing your analysis, focus on identifying the most significant changes and trends rather than getting lost in minor fluctuations. Look for changes in business trends, whether positive or negative, that could affect the company’s long-term prospects. Has customer demand accelerated or decelerated? Are competitive pressures increasing or decreasing?
Assess any improvements or weakening in the company’s financial strength. This includes changes in cash generation, debt levels and profitability margins. A company that’s generating more cash while maintaining or improving margins demonstrates stronger financial health than one experiencing the opposite trends.
Note any changes in capital allocation priorities, including adjustments to dividends and share buyback programs. Dividend increases or new buyback authorizations often signal management confidence, while cuts or suspensions may indicate financial stress or a need to preserve cash.
Evaluate changes in the financial statements that might not be immediately obvious from the income statement alone. Balance sheet changes can reveal shifts in customer payment patterns, inventory management or supplier relationships that affect business quality.
A systematic checklist helps ensure you don’t miss important elements such as:
- Revenue growth trends and sustainability
- Margin expansion or contraction across gross, operating and net levels
- Cash flow generation relative to reported earnings
- Balance sheet strength and liquidity position
- Management guidance changes and confidence level
- Competitive position and market share trends
- Capital allocation priorities and shareholder returns
Tools and Resources to Simplify Earnings Analysis
AAII members have access to powerful tools that streamline earnings analysis. The Stock Evaluator’s Snapshot tab provides immediate access to financial ratios, growth trends and consensus estimates for a company all in one location. The Ratios tab quickly reveals whether key financial metrics are improving or deteriorating, while the Financials tab provides historical context for current results.
Our A+ Investor service includes the Earnings Estimate Revisions Grade, which ranks companies from best quintile (grade of A) to worst quintile (grade of F) based on earnings surprise history and estimate revision trends. This grade provides a quick assessment of earnings momentum and analyst sentiment.
Quick and Effective Analysis
Once you become familiar with the process, an earnings release can be scanned through in about five minutes. A conference call transcript can be scanned in a similar amount of time. Reviewing actual earnings and forward guidance against analysts’ consensus estimates is also a quick process.
When there isn’t a significant change in the financial statements or business trends, the SEC filings may not need to be reviewed. Forms 10-Q and 10-K are best for finding answers to questions not addressed in the earnings release or on the conference call.
A periodic review of the company’s financial ratios will help you identify long-term trends. If the margins and debt appear to be fairly stable, you can avoid doing a broader analysis of ratios every quarter. It is still a good idea to conduct such analysis at least once per year to catch trends that may not be apparent when looking at quarterly reports.
Remember that while earnings reports provide a snapshot of business performance, they are most valuable when viewed as part of a longer-term trend. Single-quarter results can be affected by timing, seasonality or one-time events that don’t reflect the underlying business trajectory.
Focus on identifying companies with improving business fundamentals and financial strength rather than chasing short-term earnings beats. The most successful long-term investments typically come from companies that grow their earnings power while maintaining strong balance sheets and returning capital to shareholders.
All articles in the Financial Statement Analysis series can be accessed in the AAII Journal index.

Related

AAII How-To
How to Analyze Earnings Surprises
Related

Investor Professor
How to Read a 10-K Filing
Discussion
FREE REPORT

Get your free copy of our special
report analyzing the tech stocks
most likely to outperform the
market.
BARRY J from TX posted over 1 year ago:
BARRY J from TX posted about 1 year ago:
CHARLES R from IL posted about 1 year ago:
BARRY J from TX posted about 1 year ago:
BARRY J from TX posted about 1 year ago:
You need to log in as a registered AAII user before commenting.
Log InCreate an account