


- Why using technical charts alongside AI tools can be a powerful combination
- What Yahoo Finance and TradingView offer, including charting features, costs and usability
- How to craft effective prompts to use with chatbots for explanations and chart analysis
Many investors focus on using metrics and signals that best fit their investing needs, including combining financial statement analysis with charting. Among AAII members surveyed, using a combination of fundamental and technical analysis was the second-most-popular investing approach (22%). Only indexing (26%) was used more as a primary strategy.
Artificial intelligence (AI) chatbots—such as ChatGPT, Claude and Gemini—hold the promise of becoming an additional tool for investors to use in stock analysis. These chatbots continue to build their investing smarts at a breakneck pace, but they are not without their limitations. They are prone to giving authoritative-sounding responses that might be derived from out-of-date or inaccurate data. Chatbots also make mistaken assumptions about the user’s intent or misunderstand prompts. Additionally, they may be limited in how many stocks they can screen at once.
Given the interest in technical analysis, we first evaluate the charting capabilities of two of the most popular financial sites, Yahoo Finance and TradingView. We then take the next step of determining whether AI chatbots can provide additional helpful analysis, or at least catch blind spots. We conclude with a way to combine the two to get the most insightful analyses from your computer.
A Note About Charting Costs
Many investors will find the free versions of charting sites and AI agents to be sufficient for their needs. But because some useful and interesting features of charting sites are behind paywalls, this article also discusses a few features solely available in paid subscription tiers.
Before spending any money, note that AAII’s Stock Evaluator provides a stock chart with a selection of technical indicators that is available to all members. Additionally, many brokers offer more advanced desktop or web-based charting and trading platforms for free. These brokers often don’t require a minimum initial deposit to get most of their apps’ features, so their tools can be used without cost or financial risk. If more sophisticated tools are desired, you can also check to see whether your broker offers a dedicated trading platform that suits your needs. Charles Schwab’s thinkorswim and Interactive Brokers’ IBKR Desktop (which is much friendlier than their Trader Workstation) are professional-grade tools, but they come with steep learning curves.
Two Top Websites for Charting
There are two websites that individual investors seeking advanced charting tools will find particularly helpful: Yahoo Finance and TradingView. You can create charts on either site, and then ask a chatbot for a second opinion.
Yahoo Finance
Yahoo Finance is an excellent choice for investors seeking a balance of user-friendliness and customization. Like most financial websites, Yahoo Finance has subscription tiers ranging from free to $49.95 per month, with discounts available for paying annually up front.
The free Advanced Chart, accessible via a button at the top-right corner of the standard chart on any stock’s page, has 19 chart types, over 120 technical indicators and 30 drawing tools. The highest-priced Gold tier introduces customizable layouts and technical pattern recognition, which can identify 50 different patterns (Figure 1).
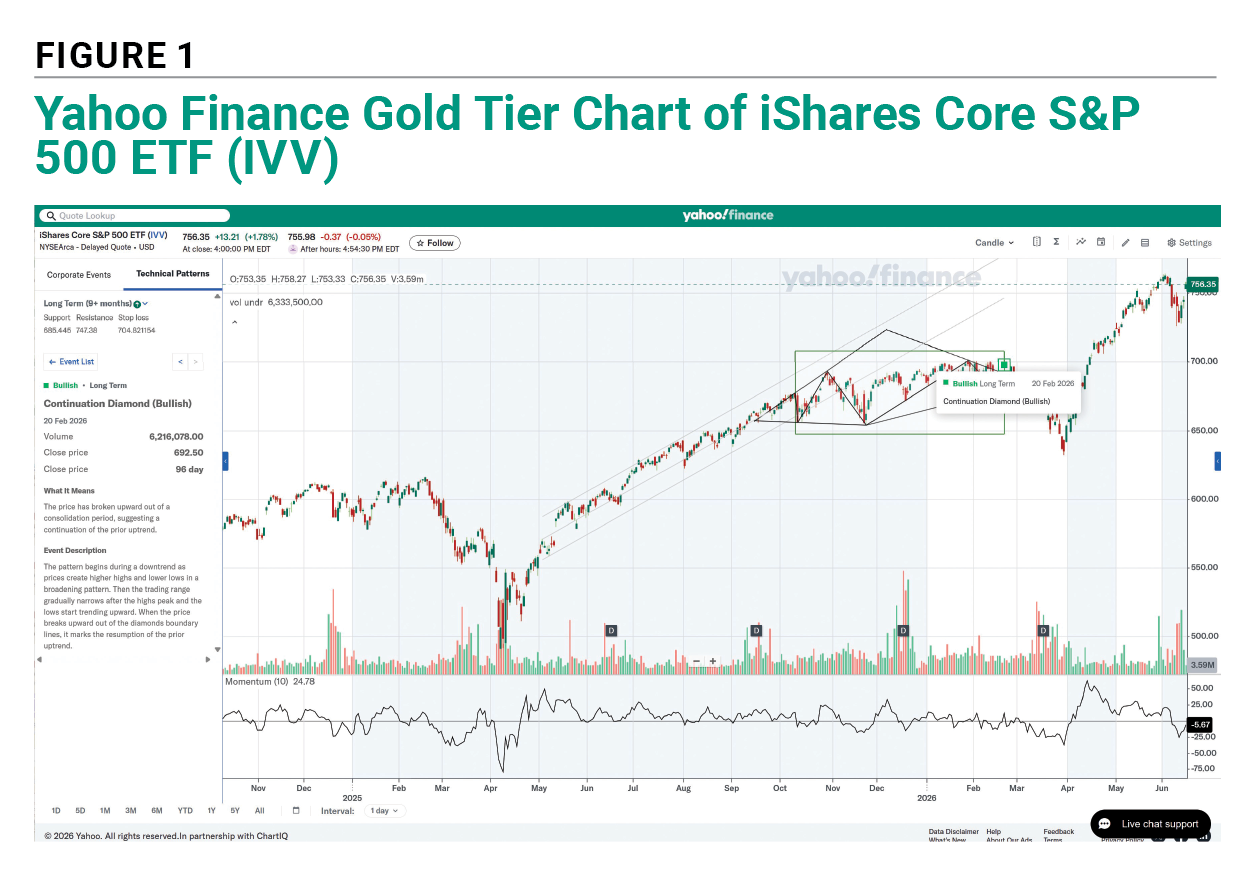
Technical events are clearly displayed, with definitions easily available. Charts can include some fundamental events, such as dividends, guidance and performance. Higher subscription tiers offer more plottable corporate events, which can be very useful in identifying what might be driving a stock move.
The Gold tier includes AI agent Yahoo Scout, which tries to respond to chart-focused queries such as:
Which stocks in the Dow Jones Industrial Average are below their 100-day simple moving average?
However, Scout is constrained by its bandwidth and access to data. When prompted to sort through stock index components, it often returned partial responses. It even confessed to making up a technical-sounding term when asked why it couldn’t access a full list, calling it a “data safety filter” issue when, in reality, it seemed to be a data tool limitation. Yahoo Scout will almost certainly improve, but it’s not trustworthy enough yet to justify subscribing on its own merits.
TradingView
Yahoo Finance’s charts are quick, but TradingView’s charts are incredibly fast, clear and visually appealing. Casual users who simply want to enter a ticker symbol and glance at a default chart style will find TradingView easy to use. Advanced users can quickly get lost in a deep subscription-laden rabbit hole as they dive into its more nuanced features (Figure 2).
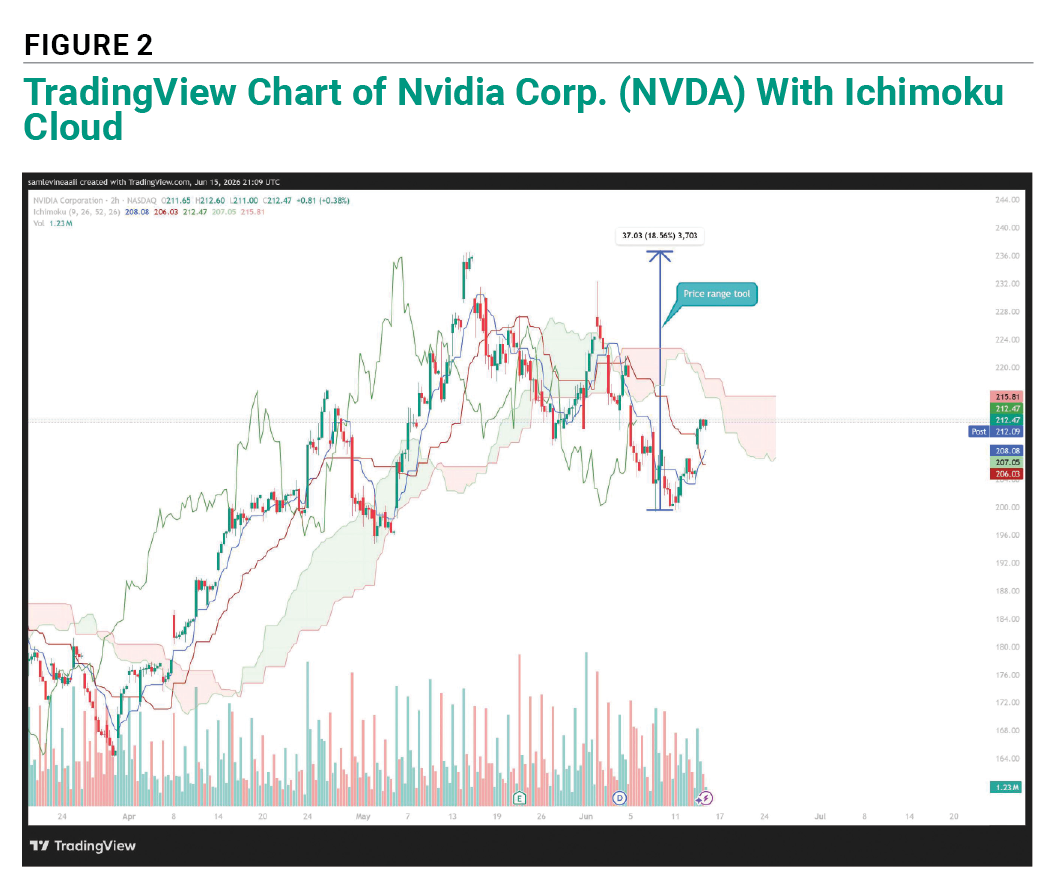
TradingView offers a broader feature set than Yahoo Finance, but it comes at the cost of complexity and, for the free tier, more advertisements than many might prefer. If you like TradingView, upgrading to their Essential tier ($16.95 per month) may be beneficial. Subscribers can create multichart layouts and put more than three indicators on each chart. The subscription upgrade push won’t stop there, though. The site doesn’t indicate when a feature is behind a paywall until you click on it and are sent to an upgrade page, which can become frustrating.
The site has 17 free chart styles, with additional styles available via a paid subscription. Compared to Yahoo Finance—which provides enough drawing tools for most chart users—TradingView is a veritable Picasso of charts, with over 85 different markup tools. There’s a handy price target tool that measures a position’s risk/reward ratio. There are tools for Elliott Wave devotees, Gann theory fans and price pattern templates as well.
TradingView also has one of the most niche charting features: Users can add indicators to indicators—a premium subscription isn’t even required. The site gives the example of applying Bollinger Bands to a simple moving average. As interesting as this capability might be, it’s worth considering whether the combination is useful.
The Essential tier provides automated pattern recognition and does a better job at highlighting patterns than Yahoo Finance.
AI Chatbots Excel at Explanations but Not Screening
After comparing those two charting websites, we tested five popular chatbots for their ability to define and explain technical terms: ChatGPT, Claude, Gemini, Grok and Perplexity. We also assessed their access to market data, the relevance of their responses, their suggestions for further research and their sources.
All of the tested chatbots provided useful responses to this prompt:
What is an Ichimoku Cloud? What is it used for? How does it differ from other chart types?
Gemini clarified that an Ichimoku Cloud is an overlaid indicator, not a distinct chart type. ChatGPT compared the utility of Ichimoku Clouds to other indicators used by position traders. Perplexity and Grok cited sources, which are useful when additional clarification is called for.
It would be terrific if we could log on to our computers and ask an AI chatbot to identify which stocks are likely to outperform based on statistically reliable backtesting and the amount of risk we are willing to accept. Unfortunately, the AI chatbots available to individual investors aren’t as cooperative as we might prefer.
We also prompted each chatbot with this:
Identify which Dow components were trading below their 10-day simple moving averages as of market close on June 12, 2026, and, if applicable, explain why you were not able to compile a complete list.
This was intended to test their access to rudimentary market data. None of the chatbots returned a complete list of stocks. They blamed their lack of access to data feeds, which is surprising given the breadth of stock data available on Yahoo Finance and Google Finance.
Gemini speculated that the day’s biggest decliners might be candidates for breaking below the 10-day moving average, which is conceivable but not overly helpful. ChatGPT also gave a rundown of notable decliners and mentioned that it sought out technical analysis pages displaying only current data, not the historical data required to compute the moving average.
Grok’s response reminded us that chatbots’ responses could favor their owners. The chatbot is owned by Space Exploration Technologies Corp.  (SPCX), better known as SpaceX. While Grok devoted a significant amount of its response to the general market environment on June 12, 2026, it also specifically mentioned SpaceX’s initial public offering (IPO), which occurred that same day but had little relevance to the prompt. None of the other chatbots’ responses mentioned SpaceX.
Given how poorly the AI agents performed when given such a simple query, it seemed pointless to test more detailed screens. Without access to good data, the conversational agents wouldn’t be able to screen the S&P 500 index for reverse head-and-shoulders patterns or candlestick continuation patterns.
Can AI Chatbots Read Charts?
ChatGPT did suggest a workflow that many individual investors will appreciate. Investors can upload screenshots of charts to AI chatbots to get technical analysis opinions.
When asked to design a prompt that would compel it to thoroughly analyze a chart, ChatGPT suggested the following prompt.
Analyze the attached chart as a professional technical analyst.
Please:
1. Identify the primary trend (short-, intermediate-, and long-term).
2. Describe any notable chart patterns.
3. Identify key support and resistance levels.
4. Analyze volume, momentum, and moving averages.
5. Assess whether the stock is in accumulation, distribution, or consolidation.
6. Provide the strongest bullish and bearish arguments.
7. Estimate the probability of bullish, neutral, and bearish outcomes over the next 1–4 weeks.
8. Identify a reasonable entry, stop-loss, and target for a position trader.
9. Highlight any technical warning signs that could invalidate the setup.
10. Give an overall technical rating from 1–10 and explain why.
Be objective and evidence-based. Do not make fundamental assumptions unless they are visible on the chart.
This appears to be a useful generic prompt that can be easily tweaked in the future for other analyses. We used this prompt to test all of the chatbots on a basic six-month candlestick chart of Palantir Technologies Inc. (PLTR) from mid-February to mid-June 2026 for its volatility and clear support and resistance (Figure 3).
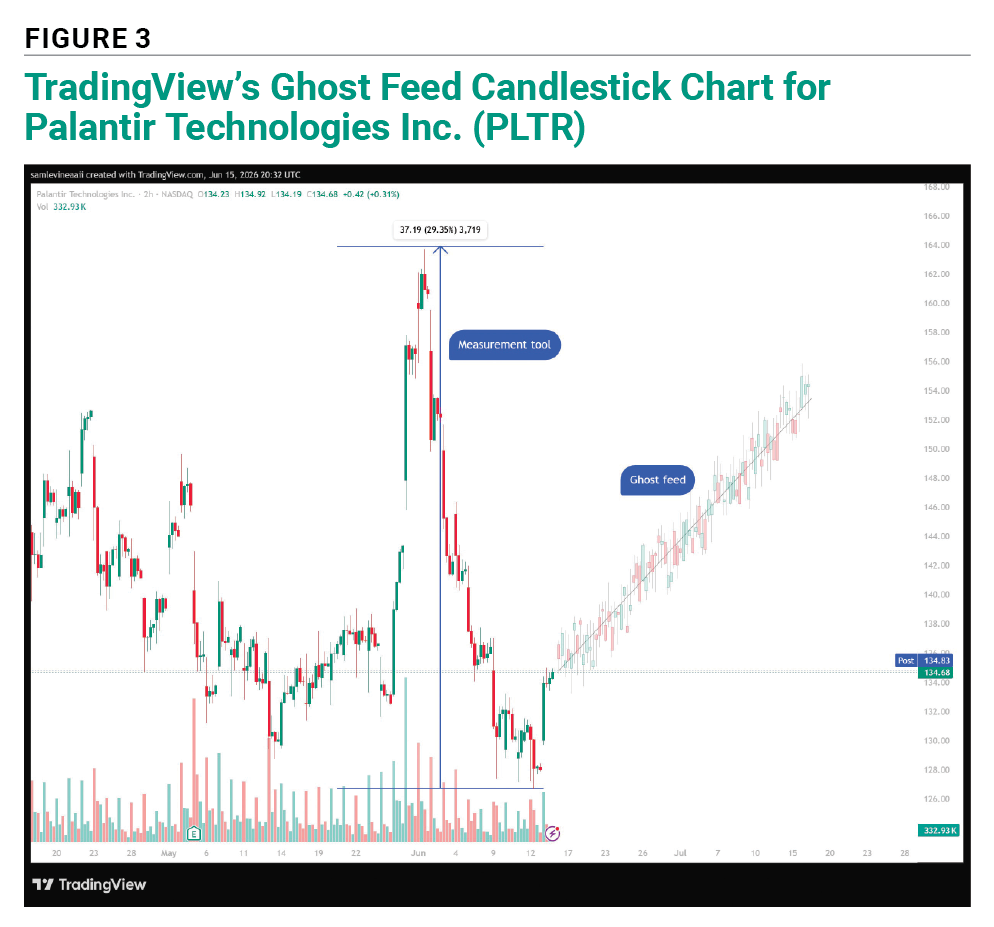
The prompt structure has some important traits. First, it specifies the level of expertise, that of a professional technical analyst. Then, it demands prominent patterns—not every pattern, just the most noteworthy ones. Most importantly, the prompt requires the AI agent to provide counterarguments against its conclusions, which promotes deeper analysis. Lastly, it asks for the chatbot’s reasoning, which helps users evaluate whether the AI agent generated a reliable response instead of the speediest reply.
It was startling how similar the chatbots’ analyses were when compared side by side. All agreed that Palantir was not an attractive buy candidate. ChatGPT and Perplexity rated the stock a 4 out of 10. Grok gave the stock a score of 3.5. Claude and Gemini also gave Palantir a thumbs-down with a score of 3.
ChatGPT’s bottom-line assessment for a position trader was that Palantir was in a “bearish trend testing major support.” Grok was even more cautious, calling the chart a “weak technical picture” and adding that the “weight of evidence points lower until proven otherwise.” Gemini went a bit further by discouraging the user from buying the stock. It cautioned: “While the proximity to a major historical support level prevents it from being a 1 or a 2, trading an asset purely because ‘it has fallen a lot to support’ is dangerous when short-term momentum is this severely bearish.”
Table 1 compares the AI agents’ estimated probabilities for bull, bear or neutral cases over the next four weeks, beginning on June 15, 2026.
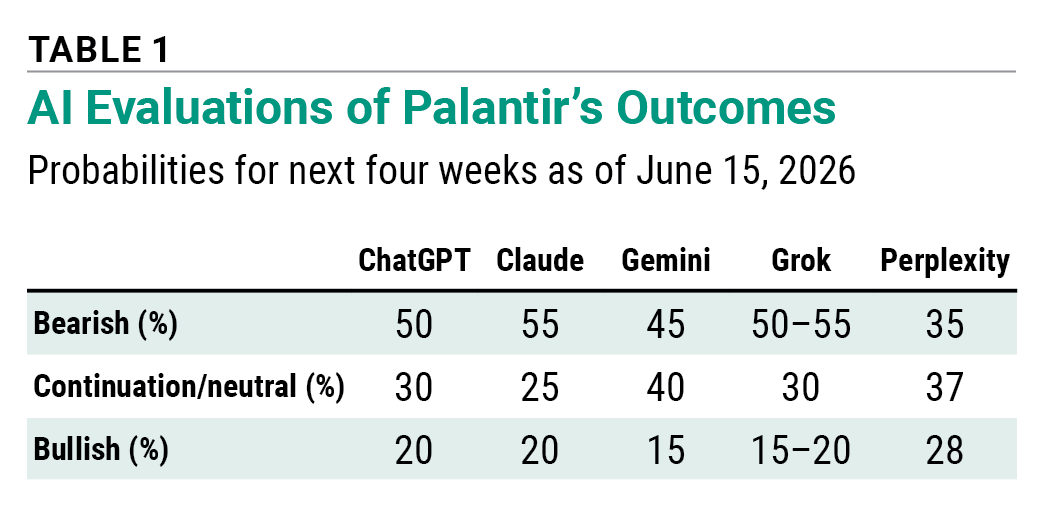
It’s hard to imagine any sized group of human analysts, whether fundamentally biased or motivated by technicals, coming to similar conclusions. The consensus could stem from the chatbots pulling information from the same sources or from the chart’s relatively clear technical picture. It’s easy to open four or five chatbots at once, upload a screenshot or PDF of a chart, paste the prompt, and look for similarities and divergences between the different AI agents’ analyses.
Support and Resistance for AI-Aided Chart Analysis
Chatbots excel at defining technical analysis indicators and rules, but those definitions have been available online for years. TradingView provides easy access to very detailed explanations on its charts and sidebar, as do the charting packages of many brokers. One advantage that chatbots have over charting sites’ static definitions is their propensity to ask follow-up questions for clarification of their user’s intentions.
We wish we could report that ChatGPT or some of its peers could generate lists of carefully vetted stocks with appealing signals. The technology—or the economics driving the technology—is not there yet. Some chatbots may be capable of writing scripts for charting packages that would list stocks with desirable technical attributes, but we didn’t evaluate this function.
As thrilling and promising as AI might appear, it is not reliable enough to trust its responses. Assertions of fact should be checked if they are relevant to a pending investment decision. AI-generated assessments should be supported by the weight of evidence. Investors should challenge chatbots’ responses when they appear ambiguous or suspect. An investor might ask how the chatbot came to a particular conclusion and watch it retract its previous response and come to an opposite conclusion.
Our testing found that the most reward came from asking multiple chatbots to analyze individual charts. Investors might start by paring down a fundamentally driven AAII screen to a list of five stellar candidates. From there, they might create charts of the five stocks with their preferred chart type and indicators, upload them to a chatbot, and describe the specific analysis desired.
Those of you who are interested in AI should experiment with different chatbots. It can take as little as two or three minutes to create a chatbot account, and the chatbots are willing to help you create and test prompts.

Related

AAII Sentiment Investing
Looking Beyond Price Trends With the McClellan Oscillator
Related
AAII Sentiment Investing
Using Moving Averages to Guide Investment Decisions
Discussion
FREE REPORT

Get your free copy of our special
report analyzing the tech stocks
most likely to outperform the
market.
JOHN L from NJ posted about 1 month ago:
ROBERT A from NC posted about 1 month ago:
You need to log in as a registered AAII user before commenting.
Log InCreate an account