


Related

AAII Sentiment Investing
Moving averages can help distinguish between meaningful price movements and random fluctuations.
Wayne Thorp leads a class in AAII's new Essential Investing Video Course. Go to https://www.aaii.com/ves for more information and to subscribe.
Open any stock chart and you’ll often see them—smooth lines weaving through the jagged price movements like ribbons through broken glass. These are moving averages, perhaps the most widely used tool in all of investing. From day traders to pension fund managers, nearly everyone watches these mathematical constructs, which help reveal hidden order amid the market’s apparent chaos.
But what exactly are moving averages?
At its core, a moving average is simple: It’s the average price of a stock or index over a set number of days. Take the 50-day moving average, for example. Add up the closing prices from the past 50 trading days, divide by 50 and you have one point on the line. The next day, drop the oldest price, add the newest and recalculate. This process creates a line that “moves” with current prices while smoothing out daily fluctuations.
This smoothing effect is precisely why moving averages are so popular. Stock prices constantly jump—up 2.0% one day, down 1.5% the next, then up 0.8%—often for reasons unrelated to a company’s actual performance. These swings are frequently the result of short-term supply and demand imbalances. By design, moving averages filter out much of this noise, reducing the impact of “blips” or outliers and presenting a cleaner view of the underlying trend.
The most important factor influencing a moving average is its time span. Choosing the right period depends on your investment goals, interests and time horizon. For spotting long-term trends, many analysts rely on the 200-day moving average. Shorter spans—such as the 10-, 20-, 50- or 100-day moving averages—are used to capture shorter-term market movements.
If you trade on a short-term basis or operate in fast-moving markets like futures, a 10- or 20-day moving average may better match your needs. Longer-term investors, whose positions are held for months or years, often prefer the 100- or 200-day versions. These, however, are only general guidelines—every trader has unique preferences. It’s often worth experimenting with different time spans to find what works best for your style, strategy and security.
One common approach is to tailor the moving average period to the market or security’s trading cycle. In this method, the “ideal” moving average length is roughly half the length of the observed cycle, plus one day. For example, if you can identify a recurring pattern in a security’s price chart—measured from peak to peak—you can use that cycle length to guide your moving average choice:
Ideal Moving Average Length = (Cycle Length ÷ 2) + 1
This approach assumes that markets display some degree of regularity in their price movements. If prices were truly random, such patterns—and much of technical analysis—would be irrelevant. But in practice, many securities exhibit identifiable cycles that can be matched with a corresponding moving average length.
When looking at either one or several moving averages plotted on a price chart, the interpretation is generally the same. As long as the current market price is above the moving average, an uptrend is in progress. On the other hand, if the current market price is below the moving average, a downtrend is occurring. When a security’s price violates a moving average from either the upside or downside, we can interpret this as a warning flag that the current trend may be coming to an end. If the reversal lasts long enough to change the direction of the moving average, this is usually considered an indication that the current trend has ended.
Figure 1 is a chart of the S&P 500 index in which 50- and 200-day moving averages have been plotted; you can see how the average’s period affects its representation of the data. The 200-day average (red line) is smoother and flatter than the 50-day moving average (green line). Note that there is little fluctuation in its movement. Longer-term averages are popular because of how well they smooth out data.
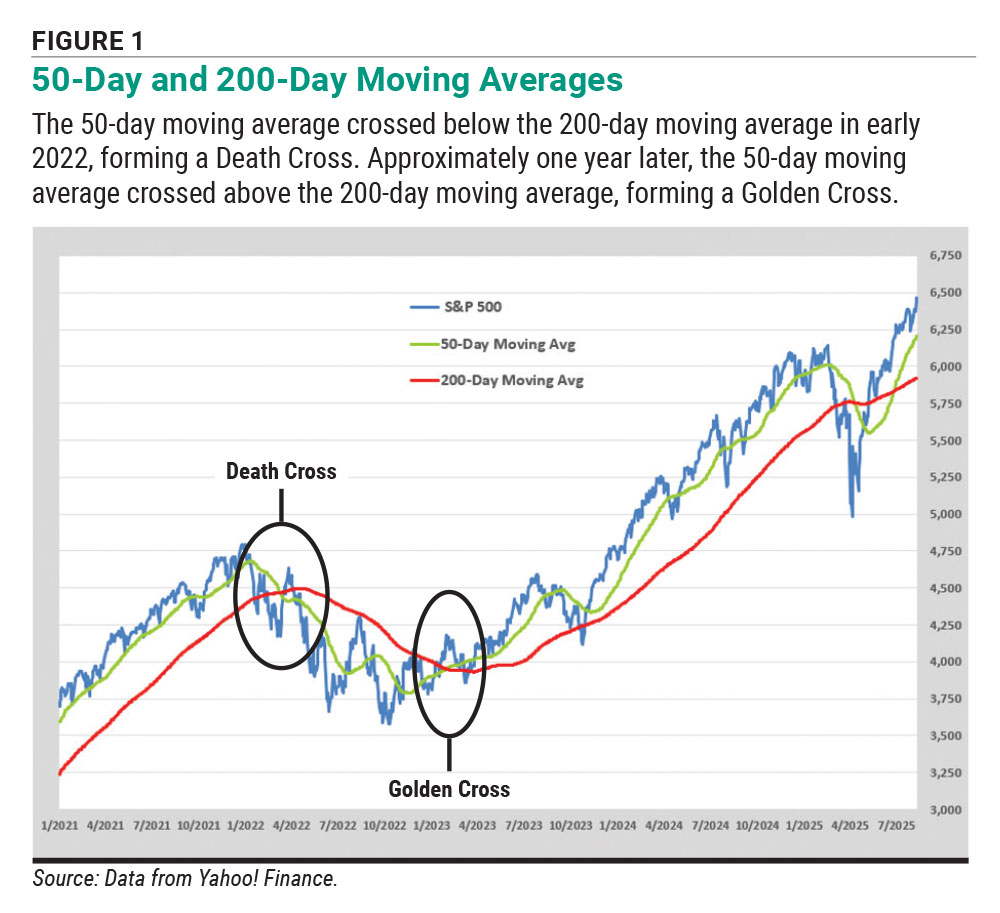
Some investors watch for points where short-term moving averages cross longer-term ones. The most well-known example involves the 50-day and 200-day moving averages: when the faster 50-day line rises above the slower 200-day line. This is called a Golden Cross and is often seen as a strong bullish signal. Conversely, when the 50-day line falls below the 200-day line, it forms a Death Cross, which is commonly viewed as a bearish warning to sell.
Notice the Death Cross in early 2022 illustrated in Figure 1, where the 50-day average dropped below the 200-day average as the S&P 500 was falling into a bear market. The subsequent bull market recovery saw prices move back above both averages with a Golden Cross in early 2023. This chart illustrates the practical application of using price position relative to both moving averages for market context.
Another important consideration when calculating moving averages is the price data you choose to use. At first glance, this might seem like a simple decision, but there are several variations worth noting. Most moving averages—unless otherwise specified—are calculated using the closing price of the security. The closing price is preferred because it reflects the level at which investors are willing to hold their positions overnight.
However, there are other common methods for determining the daily price input. Popular alternatives include the midpoint formula of (high + low) ÷ 2, the typical price of (close + high + low) ÷ 3, and the average price of (open + high + low + close) ÷ 4. Each variation offers a slightly different perspective on the day’s trading activity and can influence how the moving average behaves.
Using the average of open and close prices in a moving average calculation can provide a more balanced representation of price movement compared to using only the close price, especially in intraday charts. It captures the price range for each period, potentially smoothing out fluctuations and highlighting trends more effectively.
Once you’ve settled on the time period and price input for your moving average, one decision remains: which type of moving average to use. The most common are simple, weighted and exponential moving averages, with the difference lying in how much importance each assigns to past prices.
A simple, or arithmetic, moving average (SMA) is calculated by adding the closing prices for a set number of periods—for example, 25 days—and dividing by that same number of periods. In this approach, all days are treated equally; today’s price carries the same weight as one from 10 days ago. To compute any moving average, you’ll need at least as many days of price data as the period length—so a 25-day moving average requires 25 days of closing prices.
Simple moving averages tend to behave more steadily in volatile markets because they react more slowly to sudden changes. This can help reduce the risk of premature or false trading signals. However, some traders argue that equal weighting is misleading, believing recent price activity should carry more significance since market conditions can shift quickly. This belief led to the development of weighted and exponential moving averages, which place greater emphasis on the most recent prices.
A weighted moving average (WMA) assigns greater importance to recent prices, with older data carrying progressively less influence. To calculate it, each price is multiplied by a weight that depends on its position in the time span.
For example, in a 10-day weighted moving average, the price from 10 days ago (day one) is multiplied by a weight of 1, the price from 9 days ago (day two) by a weight of 2, and so on, up to the most recent price (day 10), which is multiplied by a weight of 10. The sum of these weighted prices is then divided by the sum of the weights (1 + 2 + 3 + … + 10) to produce the weighted average for the period.
The exponential, or exponentially weighted, moving average (EMA) is calculated by applying a percentage of today’s closing price to yesterday’s moving average. Like the weighted moving average, the exponential moving average gives more weight to recent prices, but it does so using a smoothing factor that adjusts the influence of each data point over time.
To calculate an exponential moving average, you must first decide what percentage weight to give today’s closing price. The higher the percentage, the more responsive the average will be to recent price changes. For example, in a 10% exponential moving average, you would multiply today’s closing price by 10% and add it to yesterday’s exponential moving average multiplied by 90% (100% – 10%). The formula would be:
(Today’s Close x 0.10) + (Yesterday’s EMA x 0.90)
More generally, the exponential moving average formula is:
(Today’s Close x Exponential Percentage) + [Yesterday’s EMA x (1 – Exponential Percentage)]
The exponential percentage (smoothing factor) is calculated as:
Percentage = 2 ÷ (Time Period + 1)
You can also choose your own weighting for the current price and prior average, as long as the two weights add up to 1.0. In addition, you have flexibility in deciding the type of average used to start the exponential moving average calculation—either a simple moving average or a weighted moving average.
Regardless of which starting average you use, the calculation process is the same: Take the previous day’s exponential moving average, multiply it by one minus the exponential percentage, then add today’s closing price multiplied by the exponential percentage. This method ensures that the exponential moving average remains responsive to new data while still smoothing out short-term price fluctuations.
Table 1 shows the 10-day simple, weighted and exponential average calculations. Looking at the results, you can see how the various averages represent the data. Both of the exponential moving averages (one using a simple average and the other using a weighted average) and the weighted average are greater than the simple average. This is because they place greater emphasis on the increase in stock price on day 10 (day 11 for the exponential average), the most recent day.

The expression (Time Period + 1) can also be used to calculate the number of periods of pricing data required to calculate the exponential moving average. The extra day of data is required since you must first calculate yesterday’s moving average and then implement today’s price as well. This means, for example, that if you were calculating a 25-day exponential moving average, you would need 26 days of prices.
As the calculations in Table 1 show, the difference between the various averages is not very significant for a short(er) period of time. However, when you compare the results of the averages over a longer period of time, the difference becomes more apparent and significant.
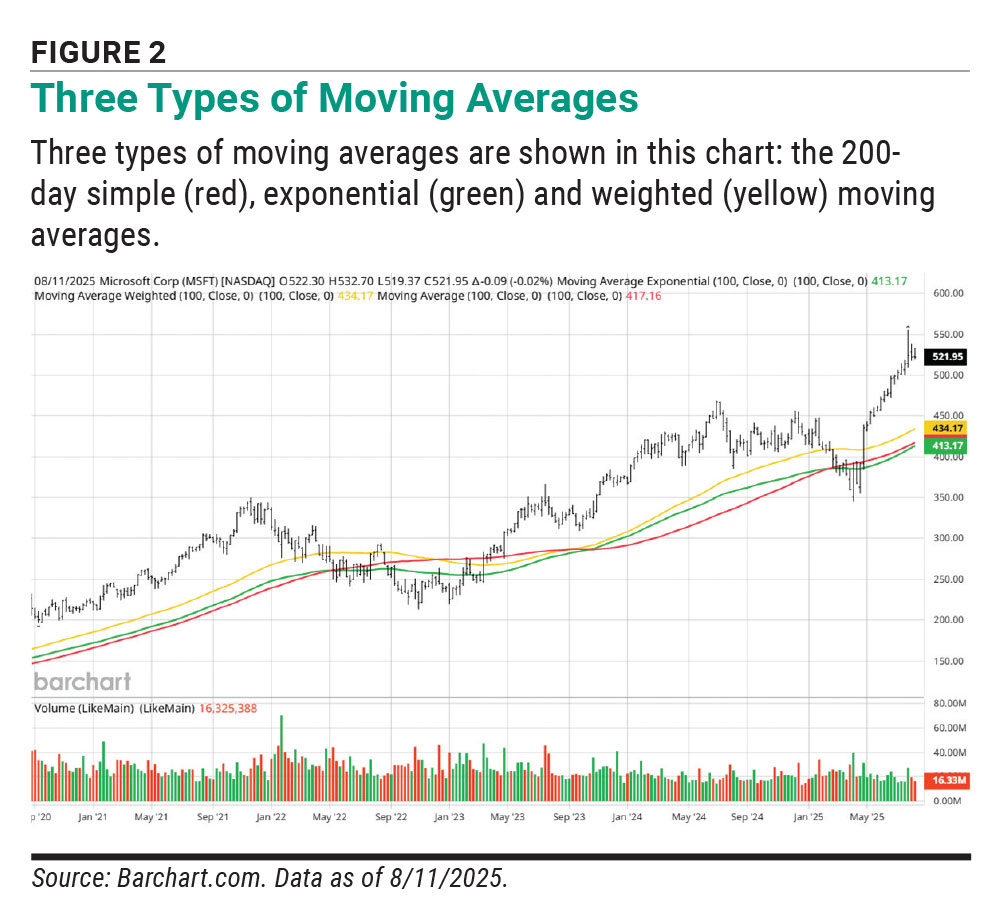
The price chart in Figure 2 for Microsoft Corp.  (MSFT) displays the 200-day simple (red), exponential (green) and weighted (yellow) moving averages. The first thing to note is that all three averages lag behind the actual price data—hence the term “lagging indicators.” Among them, the exponential and weighted moving averages respond more quickly to price changes, as they give greater weight to the most recent prices. In the fourth quarter of 2023, as Microsoft’s stock price climbed, the three averages were closely clustered. The chart shows that the weighted moving average (yellow) was the most sensitive to the uptrend, followed by the exponential average (green), while the simple moving average (red) was slower to shift upward.
Moving averages seem to offer a systematic solution to one of investing’s most challenging problems: distinguishing between meaningful price movements and random fluctuations.
Moving averages can be a helpful tool for the active investor. Here’s how to think about them realistically.
Consider valuation levels, economic conditions and business fundamentals in conjunction with any technical indicators.
AAII recently launched a new Sentiment Investing Dashboard to help you interpret and apply sentiment indicators. It includes 10+ indicators measuring investor sentiment and market sentiment, breadth, valuation, trend and volatility. Fifty-day and 200-day moving averages for the market are tracked in the S&P 500 Trend indicator. Find out more at the AAII Sentiment Investing site.
AAII Sentiment Investing

AAII Sentiment Investing

AAII Sentiment Investing

BARRY J from TX posted about 1 year ago:
Wayne T from IL posted about 1 year ago:
ROBERT A from NC posted about 1 year ago:
Robert K from MA posted about 1 year ago:
You need to log in as a registered AAII user before commenting.
Log InCreate an account