


Related

Investor Professor
The most reliable signals occur when extreme TRIN readings align with other technical indicators and happen during high-volume sessions.

Wayne Thorp leads a class in AAII's new Essential Investing Video Course. Go to https://www.aaii.com/ves for more information and to subscribe.
With markets hitting new highs and volatility lurking around every corner, knowing when sentiment has reached extremes could save your portfolio. The Arms Index, also known as the TRIN (Trading Index), has been measuring market breadth and volume since 1967, catching capitulation points that mark major bottoms. But in today’s algorithm-driven markets, does this classic indicator still work? The answer might surprise you.
The TRIN combines two critical market measurements into one powerful indicator: how many stocks are rising versus falling, and how much volume flows into each group. When advancing stocks receive disproportionate volume, the TRIN drops below 1.0, signaling bullish sentiment. When declining stocks attract heavy volume, the TRIN rises above 1.0, indicating bearish conditions.
Here’s why the TRIN matters: While most investors panicked during the March 2020 pandemic crash, the TRIN spiked up. Those who recognized its extreme oversold signal and bought saw the S&P 500 index surge 70% within months. But there’s a catch: Recent academic research reveals that the TRIN’s predictive power has “drastically weakened” since the 2000s, making it crucial to understand both its strengths and its limitations.
Richard W. Arms Jr. developed the formula for the Arms Index, which divides the Advance/Decline ratio (ADR) by the Advance/Decline volume ratio:
TRIN = (Advancing Issues ÷ Declining Issues) ÷ (Advancing Volume ÷ Declining Volume)
Consider a bullish market day with 2,300 advancing stocks and 739 declining stocks where advancing volume totals 1,200 million shares and declining volume reaches 140 million shares. The calculation proceeds as follows:
This TRIN reading of 0.36 indicates strong bullish sentiment, as advancing stocks receive disproportionately high volume support.
Professional traders typically apply the TRIN to major exchanges; the New York Stock Exchange (NYSE) TRIN (ticker: $TRIN) and the Nasdaq TRIN (ticker: $TRINQ) are the most widely followed. The calculation includes all listed securities on each exchange, including common stocks, preferred shares, real estate investment trusts (REITs) and exchange-traded funds (ETFs). This broad inclusion can sometimes create distortions, particularly on the NYSE, where bond closed-end funds may affect readings during periods of fixed-income volatility.
Standard interpretation thresholds have evolved through decades of market observation. Readings below 0.5 indicate extreme overbought conditions, suggesting potential bearish reversals. The 0.5–0.7 range signals overbought conditions, warranting caution for long positions. Readings between 0.7 and 1.2 signal that markets are exhibiting neutral, balanced conditions. Readings from 1.2 to 2.0 suggest oversold conditions, presenting potential bullish opportunities. Values exceeding 2.0 indicate severe oversold conditions, with a high probability of bounces, while readings above 3.0 represent extreme oversold conditions, often coinciding with significant market bottoms.
These thresholds require adjustment in response to market conditions. During volatile periods, the practical range may expand to 0.75–2.25, while trending markets may see sustained extreme readings without immediate reversals. The TRIN’s 10-day moving average provides more stable signals, with oversold conditions above 1.2 and overbought conditions below 0.8, as initially recommended by Arms.
The difference between raw and smoothed TRIN readings proves critical for practical application. Raw TRIN readings exhibit high volatility, making them prone to false signals but highly sensitive to immediate market changes. The 10-day simple moving average reduces noise and provides more reliable medium-term signals, albeit at the expense of responsiveness. Most swing traders prefer the smoothed version, while day traders rely on raw readings for immediate sentiment assessment.
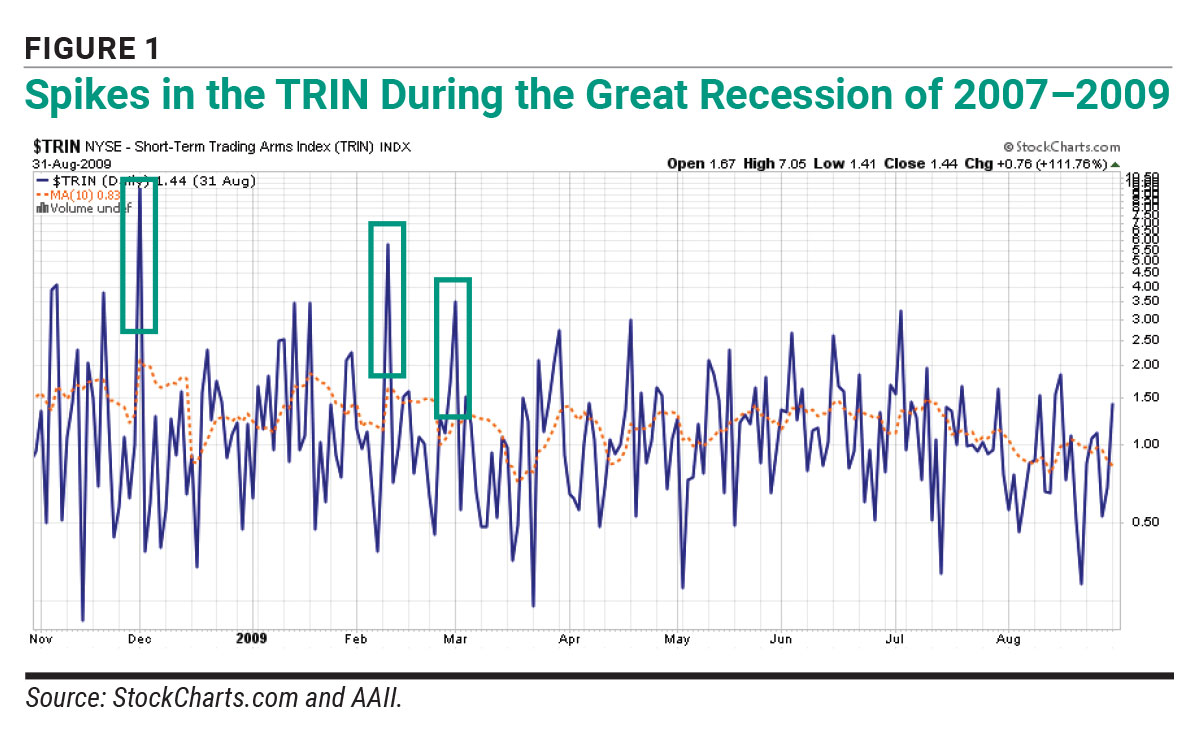
Historical analysis reveals consistent TRIN patterns during significant market events. During the Great Recession, TRIN readings spiked above 3.0 during major selling climaxes. The March 2009 market bottom likely coincided with extreme readings above 4.0 (Figure 1). These panic-selling indicators provided contrarian buy signals for those monitoring market breadth.
The coronavirus pandemic crash in March 2020 compressed typical bear market dynamics into just 33 days. During the fastest bear market in history, the TRIN reached extreme levels above 3.0 multiple times, with readings coinciding with the March 23 market bottom, providing early signals of potential reversal (Figure 2). The indicator’s ability to identify capitulation proved valuable despite the unprecedented speed of both decline and recovery.

Professional traders emphasize that extreme TRIN readings don’t guarantee immediate reversals, but instead indicate high-probability turning points. The most reliable signals occur when extreme TRIN readings align with other technical indicators and happen during high-
volume sessions. Studies suggest that TRIN readings above 3.0 have provided reliable short-term buy signals in 70% to 80% of historical cases.
The most prevalent misconception involves the TRIN’s inverse relationship. Many traders incorrectly assume that higher values indicate bullishness, leading to costly misinterpretations. This confusion stems from the indicator’s counterintuitive design, where values above 1.0 indicate selling pressure.
Overreliance on the TRIN as a stand-alone indicator represents another critical error. Professional sources universally emphasize that the TRIN requires confirmation from other technical tools. The indicator’s mathematical structure can produce false readings, particularly during unusual volume distributions. Successful traders view the TRIN as one component of a comprehensive analytical framework, rather than a definitive signal generator.
Confusion about calculation components creates additional problems. Many investors are unaware that the TRIN weights stocks by share volume rather than dollar volume, resulting in a systematic bias toward lower-priced stocks. A heavily traded penny stock affects the TRIN more than the equivalent dollar volume in a blue-chip stock, potentially distorting readings during periods of speculative activity in low-priced issues.
Rigid application of threshold levels without considering market context leads to frequent whipsaws. Traders often apply standard overbought/oversold levels (0.5/3.0) regardless of prevailing volatility or trend strength. Professional analysis suggests that these thresholds necessitate ongoing adjustments based on recent market behavior and historical volatility patterns.
The TRIN’s formula contains inherent mathematical flaws that can produce misleading signals. The most significant involves the neutral reading paradox: When advancing issues and volume both double relative to declining components, the TRIN can be at 1.0 despite clearly bullish conditions. Even more problematic scenarios arise when three times as many stocks advance with only twice the volume as declining stocks, producing a bearish 1.5 reading during a positive session.
Volume-weighting issues compound these mathematical limitations. The emphasis on share count rather than dollar volume creates distortions favoring high-volume, low-priced stocks. Technology sectors with traditionally lower share prices can disproportionately influence the TRIN, making it less representative of broad market sentiment. This bias becomes particularly pronounced during speculative periods when penny stock volume surges.
The indicator’s asymmetric scale presents challenges for visualization and interpretation. The TRIN can spike to 3.0 or higher during periods of selling pressure, but it rarely drops below 0.3 during buying frenzies. This creates an unbalanced visual representation with “high spikes but shallow dips,” complicating pattern recognition and historical comparison. Professional traders often apply logarithmic scaling to address this issue; however, such transformations can add complexity for individual investors.
Time frame limitations further restrict the TRIN’s utility. Intraday calculations fluctuate dramatically even under stable conditions, creating noise that triggers false signals. The indicator works poorly in strongly trending markets where extreme readings persist without reversals. Additionally, changing market structures over decades means that historical threshold levels may no longer apply to modern markets.
The TRIN exhibits varying effectiveness depending on prevailing market conditions. In strong trending markets, the indicator often remains at extreme levels for extended periods without signaling reversals. Professional traders note that waiting for TRIN-based reversal signals during powerful trends frequently results in missed opportunities or premature countertrend positions.
Range-bound markets provide the TRIN’s optimal performance environment. Oscillator-type indicators excel when prices trade sideways, and the TRIN’s overbought/oversold signals prove more reliable without strong underlying trends. During these periods, extreme readings above 2.0 or below 0.5 offer higher-probability reversal signals as mean reversion (a move back toward average levels) dominates market behavior.
Volatility levels significantly impact TRIN interpretation. High-volatility periods require more extreme readings to signal meaningful reversals, while low-volatility environments produce more reliable signals from standard threshold levels. Professional traders emphasize adjusting interpretation frameworks based on recent volatility measurements, often using the CBOE Volatility Index (VIX) or historical volatility calculations to calibrate TRIN thresholds.
Market structure differences between bull and bear markets impact the reliability of the TRIN. Some analysts note the indicator’s natural bullish bias. The long-term readings average below 1.0, which potentially confirms the upward tendency of equity markets. The TRIN appears more reliable during bear markets when contrarian signals align with prevailing pessimistic sentiment, though this may reflect survivorship bias in historical analysis.
Recent academic research reveals troubling trends in the effectiveness of the TRIN. A comprehensive study by Min Qi and Xinlei Zhao in the spring 2008 issue of The Journal of Investing found that while the TRIN historically showed “strong predictive power for returns in the near future,” this “predictability does weaken drastically or even disappear in the most recent decade.” Trading strategies based on the TRIN generated profits primarily through the frequent trading of small stocks, which have low transaction costs; however, this approach limits the practical application for most investors.
Andreas Aigner and Walter Schrabmair’s research (SSRN, 2019) identified fundamental mathematical flaws in traditional TRIN calculations. The researchers then developed a “normalized TRIN” to address price-related distortions. Their analysis revealed inconsistencies in published TRIN values and proposed dollar-weighted alternatives to reduce sensitivity to stock price levels. This work represents the most significant methodological advancement in TRIN calculation since its inception.
Current practitioner perspectives reflect this diminished confidence. Institutional traders primarily use the TRIN as a short-term sentiment gauge within multifactor models, rather than as a stand-alone signal. Integration with algorithmic trading systems focuses on the TRIN as one input among many for machine learning models. Portfolio managers emphasize the indicator’s risk management applications over its potential for alpha generation.
Modern applications increasingly combine the TRIN with artificial intelligence (AI) and alternative data sources. High-frequency trading firms incorporate real-time TRIN calculations into momentum strategies, while quantitative funds use TRIN patterns as features in predictive models. However, most professionals stress that the TRIN’s value lies in confirmation rather than primary signal generation.
The Advance/Decline (A/D) line offers smoother and less volatile signals than the TRIN. It also better identifies longer-term trends. However, the A/D line lacks the TRIN’s volume component and responds more slowly to market changes. Professional traders often combine both indicators, using the A/D line for trend confirmation and the TRIN for short-term reversal signals.
The McClellan Oscillator offers a more sophisticated mathematical foundation, utilizing exponential moving averages and standardized overbought/oversold levels. While superior for swing trading horizons of five to 20 days, it lacks the TRIN’s volume integration and immediacy. The McClellan Oscillator excels at identifying divergences, while the TRIN better captures intraday shifts.
New highs/new lows ratios effectively capture momentum extremes with less noise than the TRIN, but they lack volume consideration and respond slowly to market changes.
Each indicator offers unique advantages, suggesting a combined approach for robust market analysis.
Individual investors should view the TRIN as a valuable but limited tool within a broader analytical framework. For position traders, monitoring the TRIN’s 10-day moving average provides the best balance between signal reliability and timeliness. Extreme readings above 1.2 or below 0.8 warrant attention but require confirmation from price action and other indicators before adjusting positions.
Swing traders benefit from combining raw TRIN readings with the smoothed versions, watching for divergences between the TRIN and price movements. When the TRIN makes new extremes while prices hold support or resistance, reversal probability increases. However, acting on TRIN signals alone can lead to whipsaw losses, particularly in trending markets.
Risk management applications prove most valuable for long-term investors. TRIN readings above 3.0 have historically coincided with significant market bottoms, suggesting opportunities to add to positions during periods of maximum pessimism. Conversely, sustained readings below 0.5 may signal excessive optimism, warranting the implementation of profit-taking or hedging strategies.
Investors should consider the TRIN’s limitations when designing trading systems. The indicator’s diminished predictive power since the year 2000 reflects the evolution of market structures, increased algorithmic trading and changing participant behavior. While extreme readings still provide valuable sentiment information, expecting the TRIN to generate consistent, stand-alone trading signals ignores decades of empirical evidence.
The Arms Index (TRIN) remains a fascinating but flawed market breadth indicator. Its unique combination of price breadth and volume dynamics provides insights unavailable from simpler indicators. Yet, mathematical limitations and declining predictive power constrain its utility. Individual investors benefit most by understanding both the historical significance and current limitations of the TRIN.
Future developments may restore the TRIN’s relevance through methodological improvements, such as Aigner and Schrabmair’s normalized versions or integration with machine learning techniques. However, the core lesson remains unchanged: No single indicator provides complete market insight. The TRIN works best as one component of a comprehensive analytical approach, confirming signals from other indicators rather than generating primary trading decisions.
For AAII members, the TRIN offers the greatest value in extreme situations. Readings above 3.0 during market panics have historically marked significant bottoms, while sustained readings below 0.5 suggest excessive optimism. Between these extremes, the TRIN provides context rather than conviction. Understanding this distinction between signal and context may be the TRIN’s most valuable contribution to individual investor success.
AAII recently launched a new Sentiment Investing Dashboard to help you interpret and apply sentiment indicators such as the one described in this article. It includes 10+ indicators measuring investor sentiment and market sentiment, breadth, valuation, trend and volatility. Find out more at the AAII Sentiment Investing site.
Investor Professor
Trading Strategies
Trading Strategies

JAMES L from TN posted about 1 year ago:
Wayne T from IL posted about 1 year ago:
BARRY J from TX posted about 1 year ago:
Wayne T from IL posted about 1 year ago:
BARRY J from TX posted about 1 year ago:
You need to log in as a registered AAII user before commenting.
Log InCreate an account