


Wayne Thorp leads a class in AAII's new Essential Investing Video Course. Go to https://www.aaii.com/ves for more information and to subscribe.
- Explains how the put-call ratio reflects investor sentiment and emotion more than market fundamentals
- Shows how extreme ratio levels often signal potential market reversals using historical and behavioral patterns
- Teaches how to interpret the ratio in context and use it as part of a broader investment strategy
The stock market responds to a blend of fundamentals, technicals and emotion. But investor psychology—fear, greed, overconfidence and panic—often plays a more powerful role in short-term price movement than earnings or economic data. The Chicago Board Options Exchange’s (CBOE) equity put-call ratio is one of the most direct ways to measure that sentiment in real time.
The put-call ratio is calculated by dividing the daily volume of put options traded by the daily volume of call options traded:
Put-Call Ratio = Total Put Option Volume ÷ Total Call Option Volume
Put options are contracts that give the owner the right, but not the obligation, to sell an underlying asset—such as a stock or exchange-traded fund (ETF)—at a predetermined price (the strike price) before a set expiration date. Investors use puts in two main ways: as insurance to protect long positions against losses or to speculate that a security’s price will fall.
Conversely, call options grant the right—but not the obligation—to buy a security at a specific price before expiration. Calls are typically used to profit from rising prices or to gain leveraged upside exposure with limited capital. Professional traders often use call options for hedging and income strategies. Individual investors tend to use call options to profit from upward market moves or to earn extra income on stocks held in their portfolios (a practice known as writing covered calls).
Because put options are associated with bearish positioning and call options with bullish enthusiasm, changes in the relative volume between the two offer a window into the market’s emotional climate. A rising put-call ratio implies growing concern or pessimism. A falling put-call ratio reflects increasing bullishness or even complacency.
However, the put-call ratio is not a precision instrument for forecasting exact market turns. It does not predict exact market turns or function as a precise timing tool. It works best as a contrarian sentiment indicator. Opportunities for gains may lie ahead when sentiment becomes extremely pessimistic (a high ratio). When optimism is rampant (a low ratio), risks may be building under the surface.
How the Put-Call Ratio Evolved Over Time
The CBOE opened in 1973, listing standardized call options on a small number of stocks. That year, the exchange handled just over one million contracts. In 2024, options volume on the CBOE averaged nearly four million contracts per day.
In the early years, the put-call ratio was a basic volume measure. But as technical analysts and behavioral finance researchers studied market structure, they began to observe recurring patterns. By the 1990s, traders noticed that put-call ratio spikes often coincided with market bottoms and extreme lows for the ratio frequently came near market tops.
During the dot-com bubble of the late 1990s, the put-call ratio remained stubbornly low as investors poured money into technology stocks. After the crash, rising readings signaled fear and hedging behavior. The same pattern emerged during the Great Recession when a surge in put activity accompanied market capitulation in late 2008 and early 2009.
The coronavirus pandemic crash in March 2020 reinforced the ratio’s usefulness: Readings spiked to historical extremes as markets bottomed. These examples helped solidify the ratio’s reputation as a valuable, if imprecise, barometer of emotional extremes.
Equity Versus Index Put-Call Ratios
There are different versions of the put-call ratio. The CBOE equity-only put-call ratio is the most commonly cited, as it tracks individual stock options. The ratio excludes index and ETF options, which are often used for portfolio hedging.
The index put-call ratio includes broad market instruments like S&P 500 or Nasdaq index options. While valuable in macroeconomic analysis, the index put-call ratio can be distorted by institutional hedging, which does not necessarily reflect directional sentiment.
The equity-only put-call ratio tends to reflect pure sentiment for individual investors. This version is typically favored when using the ratio as a contrarian signal.
What Is Considered “Extreme”?
Based on CBOE data since 2007, the average daily equity-only put-call ratio is approximately 0.94. This reflects the natural bullish bias in equity markets: Over time, more calls than puts are generally traded.

While historical observations suggest general thresholds, it’s essential to interpret them in context. A reading of 1.2 might indicate elevated fear during one regime but could appear less extreme during periods of systemic stress or high-volatility environments. These thresholds are better viewed as tendencies than hard signals (Table 1).
- Above 1.2: Elevated pessimism, possibly a contrarian bullish signal
- Below 0.7: High optimism, often preceding corrections
- Around 1.0: Neutral sentiment, no clear signal
To avoid overreacting to noise, most analysts prefer to track moving averages—like the 10- or 21-day average of the put-call ratio (Figure 1). These smooth out anomalies and better reflect sustained sentiment trends.
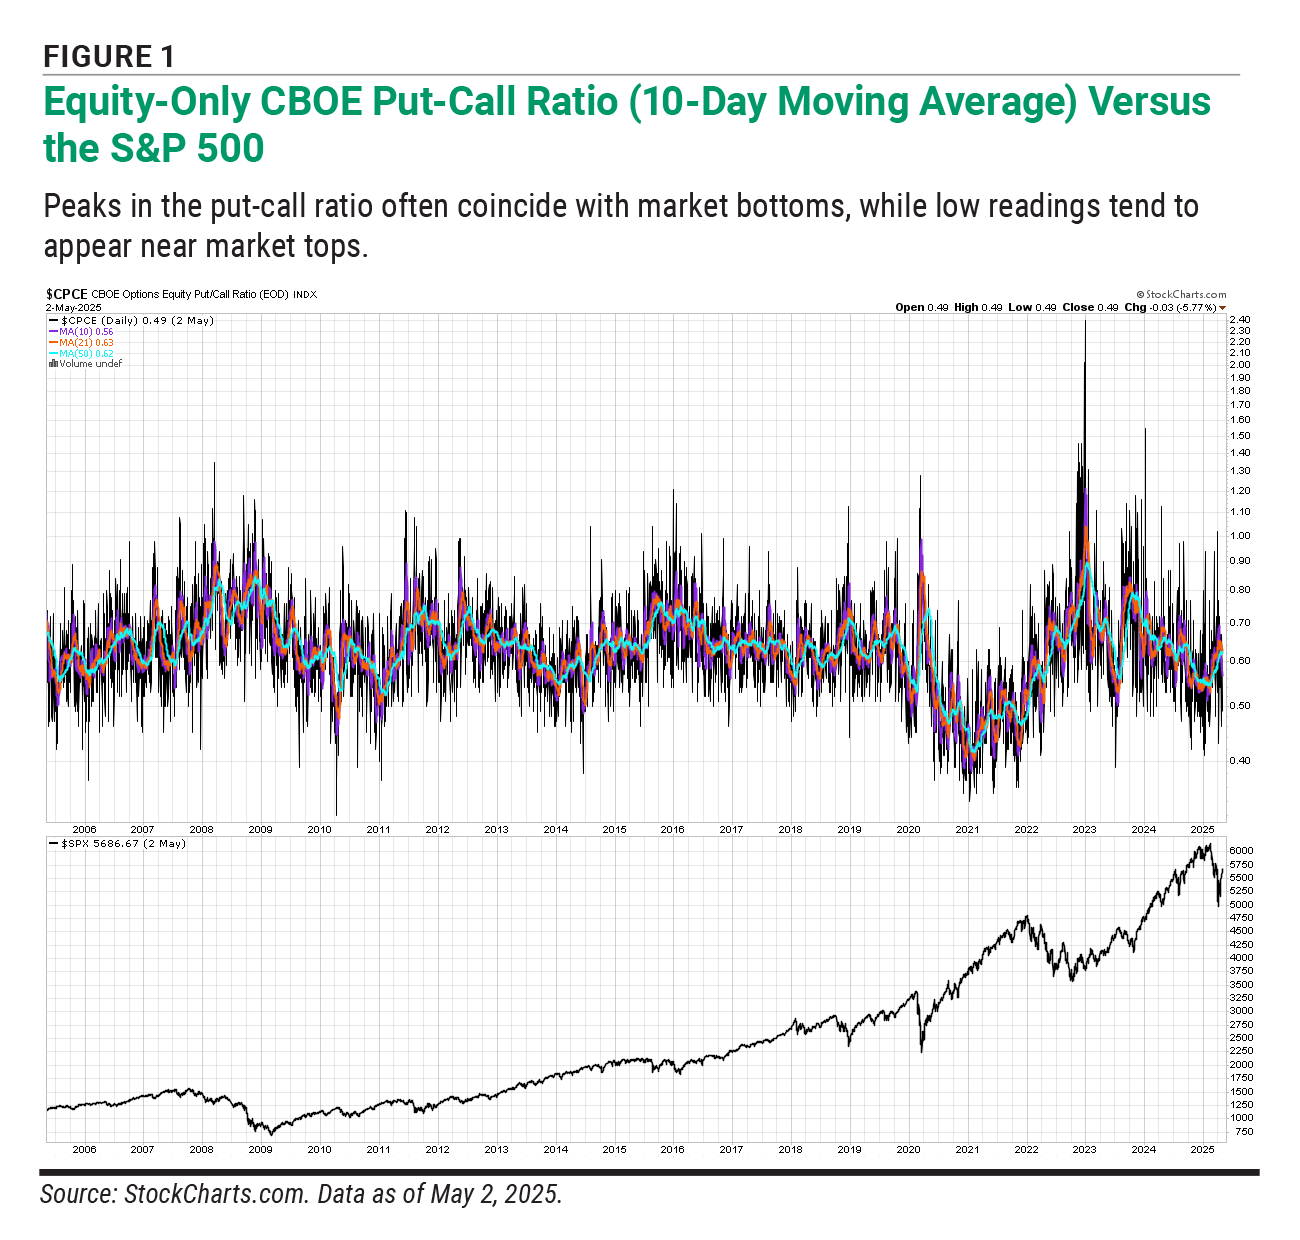
Additionally, percentile-based analysis can improve interpretation. According to research from SentimenTrader, readings in the top 5% of put-call ratio values historically tend to align with higher-than-average forward returns over 30 to 60 days. Conversely, the bottom 5% often precede flat or negative returns. That said, these are tendencies—not guarantees.
Behavioral Finance and the Ratio’s Contrarian Logic
The put-call ratio reflects actual trading of options, making it a real-money measure of sentiment. It captures the behavior—not the opinion—of investors under stress.
This makes it especially relevant to behavioral finance theory. Several cognitive biases influence how investors use options and, in turn, shape the put-call ratio. These psychological drivers push the put-call ratio to extremes, creating potential opportunities.
- Loss Aversion: People fear losses more than they value equivalent gains, leading to panic buying of puts during declines.
- Herding Behavior: Investors imitate others, especially under uncertainty, fueling waves of either call or put buying.
- Recency Bias: Traders overemphasize recent events and project them into the future, often resulting in trend-chasing.
- Overconfidence: In bull markets, call buying often accelerates as traders assume recent gains will continue indefinitely.
What the Academic Research Shows
While widely used by market professionals and technical analysts, the put-call ratio has received limited attention in formal academic literature. Still, there is evidence, primarily from industry research and select academic studies, that option-based sentiment indicators offer forward-looking insight when interpreted with care.
The most frequently cited academic study is by Jun Pan and Allen M. Poteshman, who analyzed over 100 million options trades to examine the informational content of option volume. Their 2006 paper “The Information in Option Volume for Future Stock Prices,” published in the Journal of Finance, found that abnormal buyer-initiated volume—particularly in puts—contains statistically significant predictive power for subsequent equity returns. While their research focuses on directional options flow rather than aggregate put-call ratios, it strengthens the broader claim that options activity reflects investor expectations and sentiment.
Beyond peer-reviewed studies, real-world data supports the contrarian use of the CBOE equity-only put-call ratio. CBOE researchers showed that elevated put-call readings (above 1.0), particularly when paired with high implied volatility or weak market breadth, often precede stronger-than-average 10- to 30-day returns in the S&P 500.
Similarly, SentimenTrader documented that put-call values in the top decile—signaling fear or hedging excess—tend to precede short-term outperformance, especially when multiple sentiment indicators confirm the signal.
Larry McMillan, founder of McMillan Analysis Corp. and author of “Options as a Strategic Investment” (Prentice Hall Press, 2012), has long used the 21-day moving average of the equity-only put-call ratio as a contrarian tool in his firm’s market models. His application emphasizes that extremes in sentiment tend to precede reversals, especially when confirmed by technical divergences.
That said, the statistical power of the put-call ratio alone is modest. Its effectiveness improves substantially when combined with other sentiment, volatility and price-based indicators. The put-call ratio is not a forecasting model. Rather, it is best viewed as a way to quantify emotional extremes and investor positioning—valuable context for strategy, not a signal for action.
How Institutions Use the Put-Call Ratio
Many hedge funds and asset managers use the put-call ratio not as a trading trigger but as a component in their broader market models. For example, macroeconomic strategists might include the ratio alongside futures positioning [from Commodity Futures Trading Commission (CFTC) data], ETF flows and volatility premiums to assess whether markets are becoming crowded in one direction.
Portfolio managers may also track put-call ratio trends over multiple time frames—daily, weekly and 21-day—to identify potential inflection points. When extreme readings coincide with technical support levels or valuation discounts, they may take tactical action—though always within the context of their broader process.
Options-focused strategies, such as volatility arbitrage or risk premia strategies, sometimes use put-call ratio trends to calibrate trade sizing or determine when to sell options into elevated fear.
Common Misinterpretations
While the put-call ratio is straightforward in concept, it is frequently misused. Understanding these pitfalls is essential to using the ratio effectively and responsibly.
- Assuming a high ratio guarantees a bottom: Elevated readings suggest fear but do not guarantee a price reversal.
- Reacting to single-day spikes: Short-term anomalies may be caused by event-driven flows or institutional hedges.
- Ignoring volume context: A high ratio on light volume is less meaningful than a similar reading during high-volume panic.
- Using the ratio in isolation: Without confirmation from other indicators, the ratio alone may give false or premature signals.
One way to improve the reliability of put-call ratio signals is to combine them with market breadth indicators, such as the number of stocks advancing versus declining or new lows relative to new highs.
For example, a high reading when fewer stocks are participating in a market decline may suggest exhaustion of selling pressure. Conversely, if a low put-call ratio coincides with narrow leadership in a rising market, it may signal fragile optimism.
Adding breadth context helps distinguish between healthy corrections and potential systemic fear—and makes interpretation more robust.
Using the Put-Call Ratio for Long-Term Risk Management
Even long-term investors—those with multiyear horizons—can use the put-call ratio as a risk-awareness tool.
- Rebalancing context: A spike in the ratio during a drawdown may indicate panic-selling conditions—providing psychological reinforcement to stick to a rebalancing plan.
- Stress testing: Low readings can prompt scenario analysis for a potential correction. This doesn’t imply selling but may support portfolio insurance or risk-reduction discussions.
- Behavioral calibration: The put-call ratio helps individual investors step back from the headlines and ask, “Is this emotion warranted?”
When used this way, the put-call ratio becomes a steadying influence—not a signal to trade but a reason to pause, reflect and align actions with long-term goals.
Even long-term investors can benefit from the ratio as a psychological tool during rebalancing periods. For instance, a spike in the ratio during a market drawdown may offer emotional reinforcement to follow through on rebalancing plans. At the same time, abnormally low readings could prompt scenario analysis around excessive optimism—without necessarily triggering trades.
The Impact of Zero-Day Options
The growth of zero-days-to-expiration (0DTE) options—contracts that expire on the same day they’re issued—has dramatically changed the structure of options volume. As of 2024, CBOE Global Markets data shows that zero-days-to-expiration contracts regularly account for over 40% of daily S&P 500 options volume.
Much of this activity is driven by intraday speculation, algorithmic trading and hedging flows, not long-term investor sentiment. As a result, analysts and market practitioners warn that the raw put-call ratio, particularly at the index level, may no longer reflect true emotional extremes in the market.
While the equity-only version of the put-call ratio is less impacted, the rise of zero-days-to-expiration options has led many professionals to:
- Focus on multiday moving averages to filter out short-term noise;
- Use volume-weighted or percentile-based analysis; and
- Cross-reference sentiment signals with volatility indexes and market breadth indicators.
In short, structural changes in options trading—especially the rise of zero-days-to-expiration options—mean the put-call ratio remains a useful sentiment tool, but only when used thoughtfully and in context.
Conclusion: A Sentiment Compass, Not a Market Map
The put-call ratio offers investors a rare real-time window into market psychology. It doesn’t forecast precise turning points, but it does help you understand when emotions like fear or greed are running hot.
Think of it not as a signal to act, but as a reason to pause. When the ratio spikes, it may be time to ask, “Is panic driving decisions?” When it plunges, reflect: “Has optimism gone too far?”
For long-term investors, the put-call ratio isn’t about timing trades. It’s a risk-awareness tool that can:
- Reinforce discipline during volatile drawdowns,
- Prompt discussion of portfolio stress tests during euphoric surges and
- Help you detach from the headlines and refocus on your plan.
Used with other indicators—and always in context—the put-call ratio can be a steadying force in turbulent markets. While we can’t predict sentiment, we can recognize it and respond with clarity rather than emotion.

Related

Trading Strategies
Using a Covered Call Strategy to Generate Income
Related

Investor Professor
Online Exclusive: Market Breadth's Meaning for Individual Investors
Discussion
FREE REPORT

Get your free copy of our special
report analyzing the tech stocks
most likely to outperform the
market.
ROBERT A from NC posted over 1 year ago:
Wayne T from IL posted over 1 year ago:
ROBERT A from NC posted over 1 year ago:
Wayne T from IL posted over 1 year ago:
ROBERT A from NC posted over 1 year ago:
Wayne T from IL posted over 1 year ago:
ROBERT A from NC posted over 1 year ago:
Wayne T from IL posted over 1 year ago:
ROBERT A from NC posted over 1 year ago:
JOHN L from NJ posted over 1 year ago:
Wayne T from IL posted over 1 year ago:
PATTI R from AZ posted over 1 year ago:
BARRY J from TX posted over 1 year ago:
Wayne T from IL posted over 1 year ago:
JAMES L from TN posted over 1 year ago:
Wayne T from IL posted over 1 year ago:
JAMES L from TN posted about 1 year ago:
You need to log in as a registered AAII user before commenting.
Log InCreate an account