


Related
Investor Professor
The first quarter of 2023 arguably left investors with whiplash, from March’s banking havoc to vast changes in expectations about the Federal Reserve’s next policy moves.

The first quarter of 2023 arguably left investors with whiplash. From March’s banking havoc to vast changes in expectations about the Federal Reserve’s next policy moves, there was a lot to take in. The Fed continued its campaign to quell inflation with two quarter-point (0.25%) interest rate hikes. Equity investors were optimistic, as evidenced by the widely followed S&P 500 index ending the quarter with a 7.5% bump and the Nasdaq composite rising 16.8%.
March marked a pivot to growth-oriented stocks and the technology sector as investors were optimistic that the Fed might ease its current path of tightening. The financial, energy and health care sectors were trounced. And what a difference a year makes! Most of the top 25 mutual funds and exchange-traded funds (ETFs) for the first quarter have negative trailing one-year returns.
Of the 50 most widely held no-load mutual funds, all but four posted positive returns during the first quarter. The Vanguard Total Stock Market Index Admiral fund  (VTSAX) remains a behemoth, with assets over $1 trillion. It is also an example of a large blend fund that is representative of the U.S. equity market. This fund posted a return of 7.2% for the first quarter.
While that is good news, the Vanguard Growth Index Admiral fund (VIGAX), with assets of $151.6 billion, fared much better, with a 17.2% return over the same period. Vanguard Growth Index Admiral is representative of the large growth category in the U.S. equity market. The top performer among the 50 largest mutual funds was a fellow large growth fund, Fidelity Blue Chip Growth fund (FBGRX), with a 19.6% gain. Both Vanguard Growth Index Admiral and Fidelity Blue Chip Growth also rank among the overall best-performing mutual funds for the first quarter.
Nothing is free. Scrutinizing the expense ratios of Vanguard Growth Index Admiral (0.05%) and Fidelity Blue Chip Growth (0.76%) shows that investors paid 71 additional basis points for Fidelity Blue Chip Growth’s additional 2.4% return. How similar are these funds? Fidelity Blue Chip Growth holds 308 securities, and its top 10 holdings constitute 49.5% of the fund’s assets. Nearly 7% of the fund’s portfolio is allocated to foreign stocks. Vanguard Growth Index Admiral holds 256 securities, with its top 10 holdings representing 46.7% of the portfolio. Only 1.2% is allocated to foreign stocks. Both funds’ top holdings include the biggest technology stocks: Apple Inc. (AAPL), Microsoft Corp. (MSFT), Nvidia Corp. (NVDA), Amazon.com Inc. (AMZN), Alphabet Inc. (GOOGL) and Tesla Inc. (TSLA). We point this out because a small number of high-flying technology stocks are responsible for the recent outperformance.
It is a big technology world and, unsurprisingly, large-cap blend Vanguard Total Stock Market Index Admiral also includes these technology companies in its top holdings. However, with over 3,900 securities in its portfolio, the fund is more diversified than the two aforementioned growth funds. Vanguard Total Stock Market Index Admiral’s 10 largest holdings account for approximately 21% of the total portfolio. Overall, it invests 25% in the technology sector, with consumer discretionary the next largest in terms of portfolio weight at 14.2%, followed by industrials at 13.7% and health care at 13.6%. Those additional sectors provide diversification but lowered the fund’s performance last quarter.
The top and bottom 25 ETFs and mutual funds ranked by three-month performance represent the best- and worst-performing funds from each respective universe. To make the list, mutual funds are required to have at least $5 million of assets under management (AUM), have a minimum initial purchase amount of no more than $50,000 and not charge any front- or back-end loads. ETFs are required to have AUM of at least $25 million and an average daily trading volume of at least 5,000 shares. Leveraged funds are excluded. The 50 most widely held mutual funds are the funds most likely to be owned by AAII members, allowing you to note the performance of funds held by many individual investors.
Download the Excel spreadsheet of the Top 25 ETFs table.
Download the Excel spreadsheet of the Bottom 25 ETFs table.

Download the Excel spreadsheet of the Top 25 No-Load Mutual Funds table.
Download the Excel spreadsheet of the Bottom 25 No-Load Mutual Funds table.
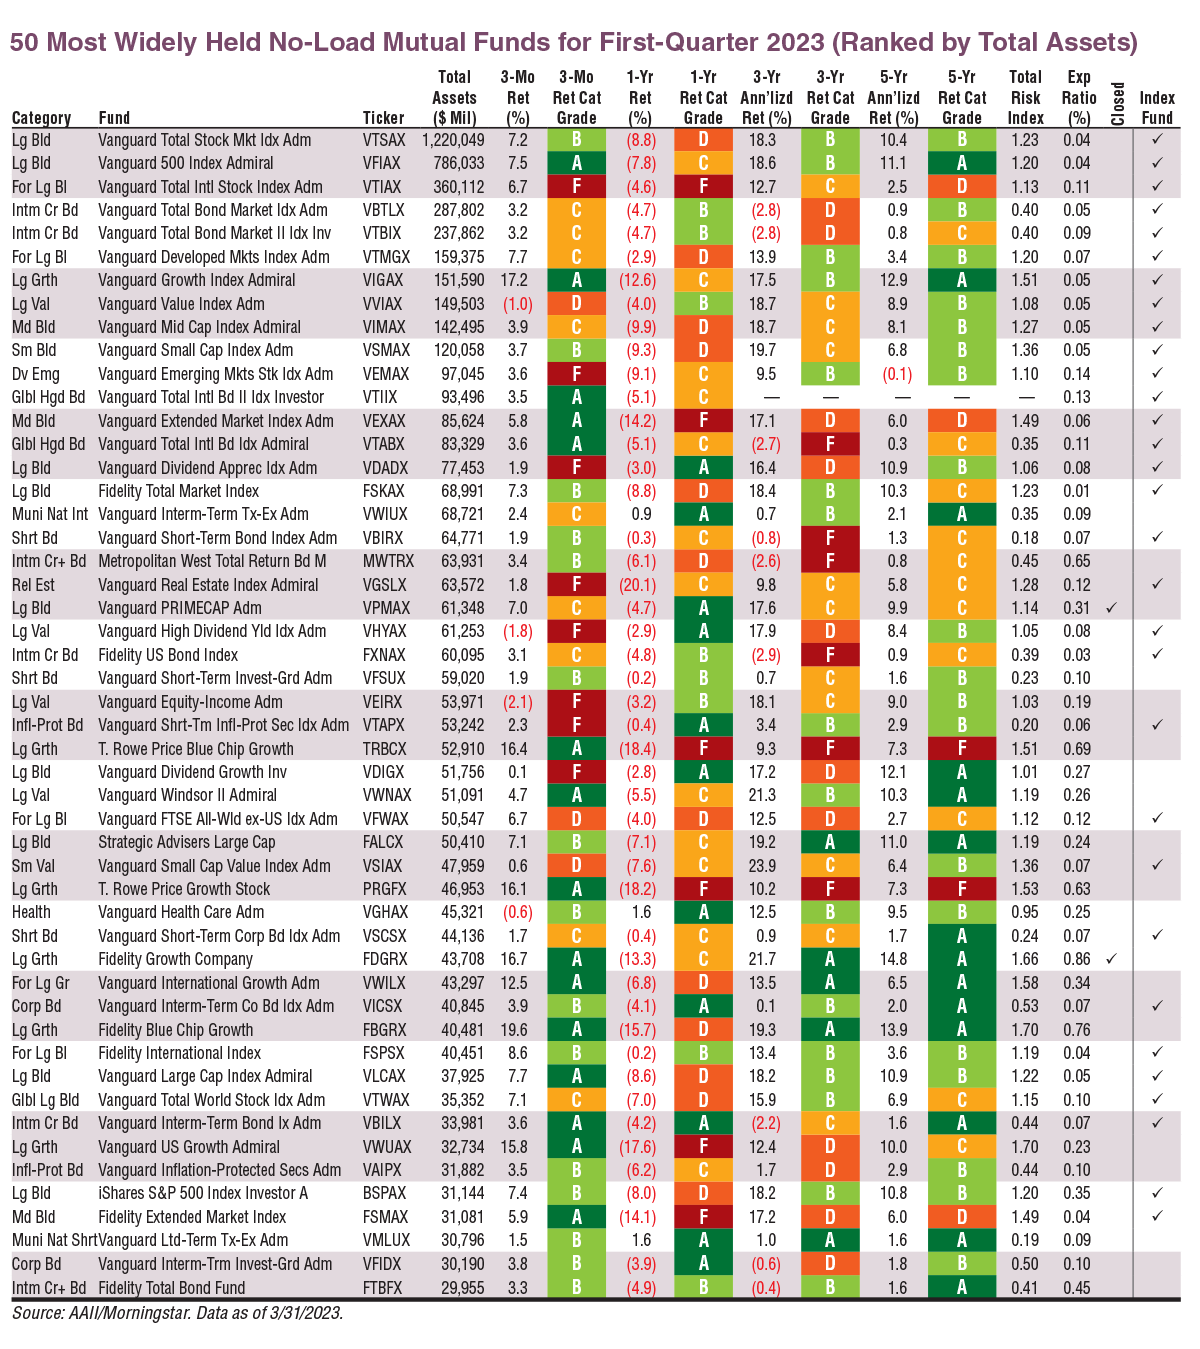
Download the Excel spreadsheet of the 50 Most Widely Held No-Load Mutual Funds table.
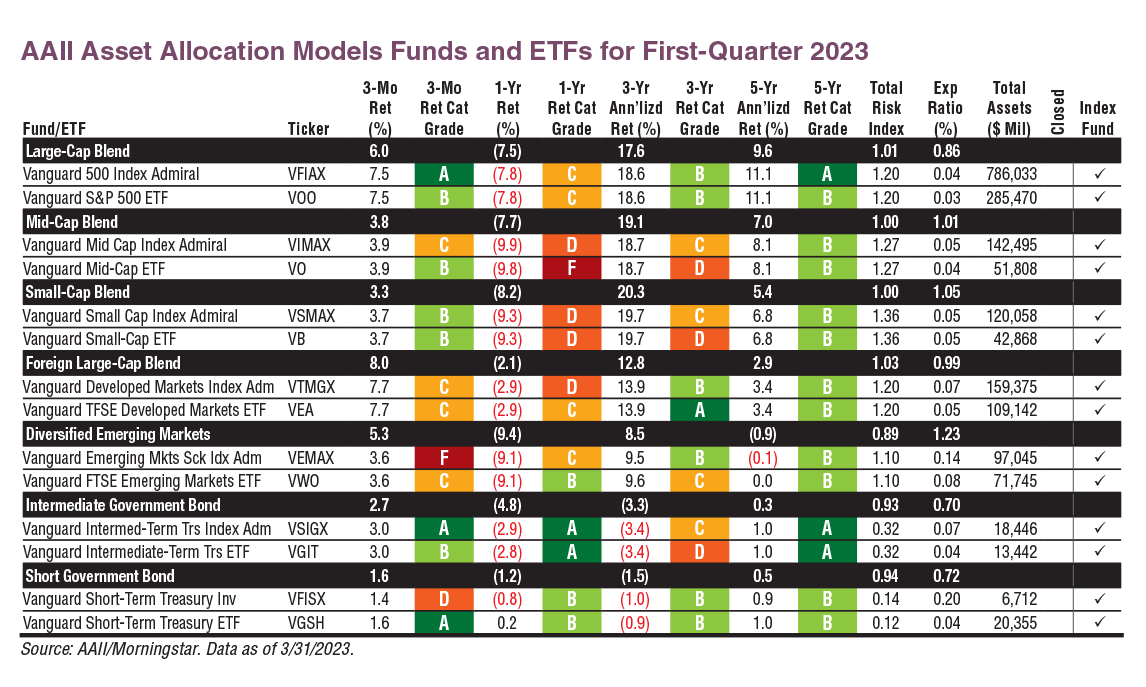
Download the Excel spreadsheet of the AAII Asset Allocation Models Funds and ETFs table.
Individual investors have long looked to the AAII Asset Allocation Models to help construct portfolios. The models incorporate stocks, bonds and cash as the three building blocks for a successful asset allocation strategy. Note that short-term bonds are listed as a proxy for cash but can be swapped with traditional cash equivalents like certificates of deposit (CDs) and money market funds.
The three models are designed for typical investors with differing risk tolerance: aggressive, moderate and conservative. The performance for each is based on hypothetical portfolios of mutual funds that represent each asset class. Vanguard index funds are used to limit the impact of decisions made by active managers on returns. These funds were also selected due to their low expense ratios. Vanguard has a unique structure where many of its ETFs are offered as separate share classes of its mutual funds. Such funds are depicted on Vanguard’s website with the language “also available as an ETF” for the admiral share class versions of its mutual funds.
Along with quarterly returns, the table above depicts the three-month, one-year, three-year and five-year returns with category grades for the funds used to track the models’ returns. We include two additional perspectives for each asset class group. The first is the category average return of similar mutual funds (e.g., the black rows with large-cap blend, mid-cap blend, etc.). The second is the performance of similar Vanguard ETFs.
As previously mentioned, the top 25 mutual fund and ETF tables tell the story of large-cap growth and technology outperformance. All mutual funds in the top-returning group netted double-digit gains. The Fidelity Select Semiconductors fund (FSLEX) was the leader, with a 38.9% return for the quarter. Coming in second was the T. Rowe Price Science & Technology fund (PRSCX), which garnered a 26.9% return. VALIC Company I International Growth fund (VCNIX) rounded out the top 10 with a return of 20.6%. A pattern with all these funds, and the previously mentioned Vanguard Growth Index Admiral fund, is that this high performance is heavily centered on large-cap technology leaders.
While the Fidelity Select Communication Services fund (FBMPX) may seem to be an exception by ranking eighth in terms of first-quarter performance with a gain of 21.2%, portfolio composition matters. The fund’s two largest holdings are Meta Platforms Inc. (META)—formerly Facebook—and Alphabet. Those two stocks account for nearly 39% of the overall portfolio. The third-largest holding is Netflix Inc. (NFLX). So, while Fidelity Select Communication Services may evoke thoughts of telecommunication companies, its portfolio is much more oriented toward internet and communications companies.
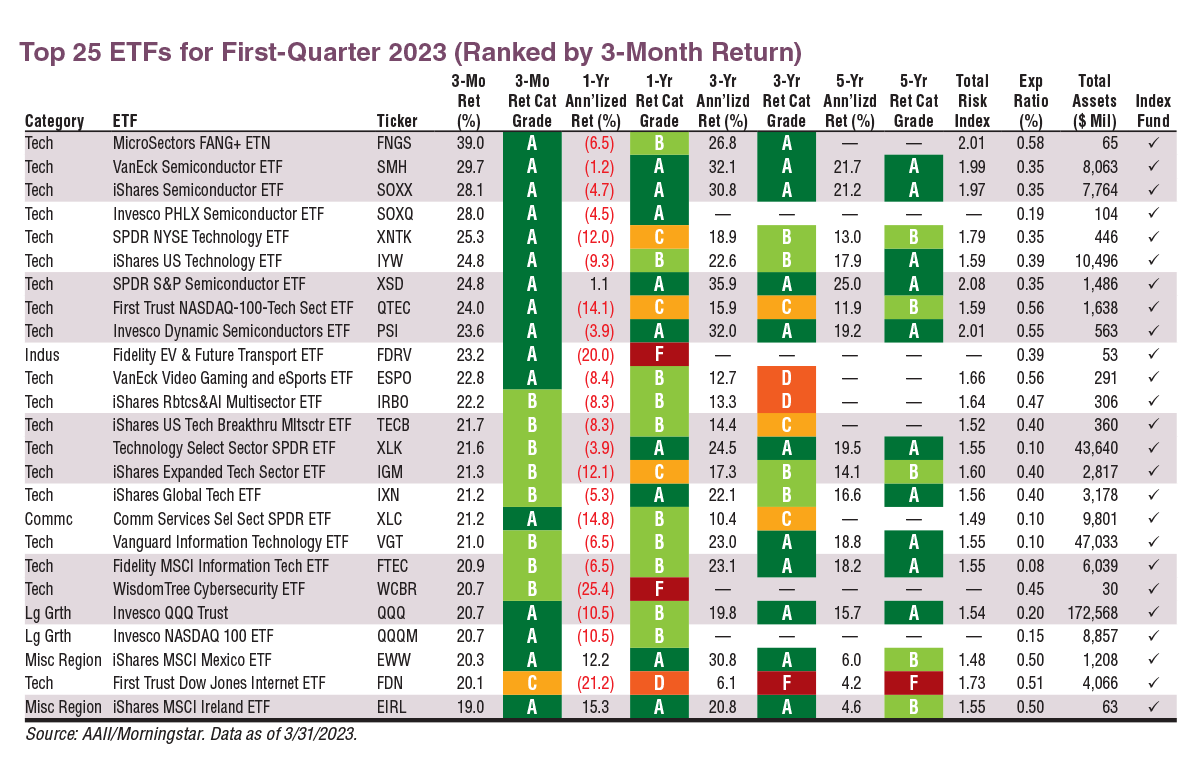
Like mutual funds, ETF three-month leaders represented a multitude of thematic technology niches. Five of the 10 best performers focused on semiconductor companies. VanEck Semiconductor ETF (SMH) had the strongest first-quarter return of the semiconductor group, gaining 29.7%. It also has a history of outperforming its peers with A+ Investor Grades of A for its one-, three- and five-year returns. (These grades show that the ETF’s returns ranked in the top 20% of its category during all three periods.)
The best-performing ETF is the MicroSectors FANG+ ETN (FNGS), which returned 39.0% for the first quarter. Exchange-traded notes (ETNs) are unsecured debt obligations that track an index and strive to pay the return on an index less management fees. MicroSectors FANG+ offers investors a return based on changes in the level of the New York Stock Exchange (NYSE) FANG+ index. This index includes 10 growth stocks from the technology and consumer discretionary sectors. [The FANG acronym originally stood for Facebook (now Meta Platforms), Amazon, Netflix and Google (now Alphabet).]
Thematic ETFs typically have higher expense ratios than their plain-vanilla counterparts that, for example, track the S&P 500. Of the top 25 ETFs, MicroSectors FANG+ has the highest expense ratio, 0.58%. Fidelity MSCI Information Technology Index ETF (FTEC) has the lowest expense ratio of 0.08% in this group. Technology Select Sector SPDR is both broader in its scope and much larger in terms of its AUM than MicroSectors FANG+ ETN.
Two country-specific ETFs made the top 25 list: iShares MSCI Mexico ETF (EWW) and iShares MSCI Ireland ETF (EIRL). U.S. domiciled country-specific ETFs provide targeted exposure to stocks and companies within a single country—in this case, Mexico and Ireland, respectively. iShares MSCI Mexico returned 20.3% and iShares MSCI Ireland returned 19.0% for the first quarter. Though the expense ratios for both ETFs are among the highest in the table, they both have expense ratio grades of B (lowest 40% for the international equity category). This is because investing overseas is typically more expensive than investing domestically.
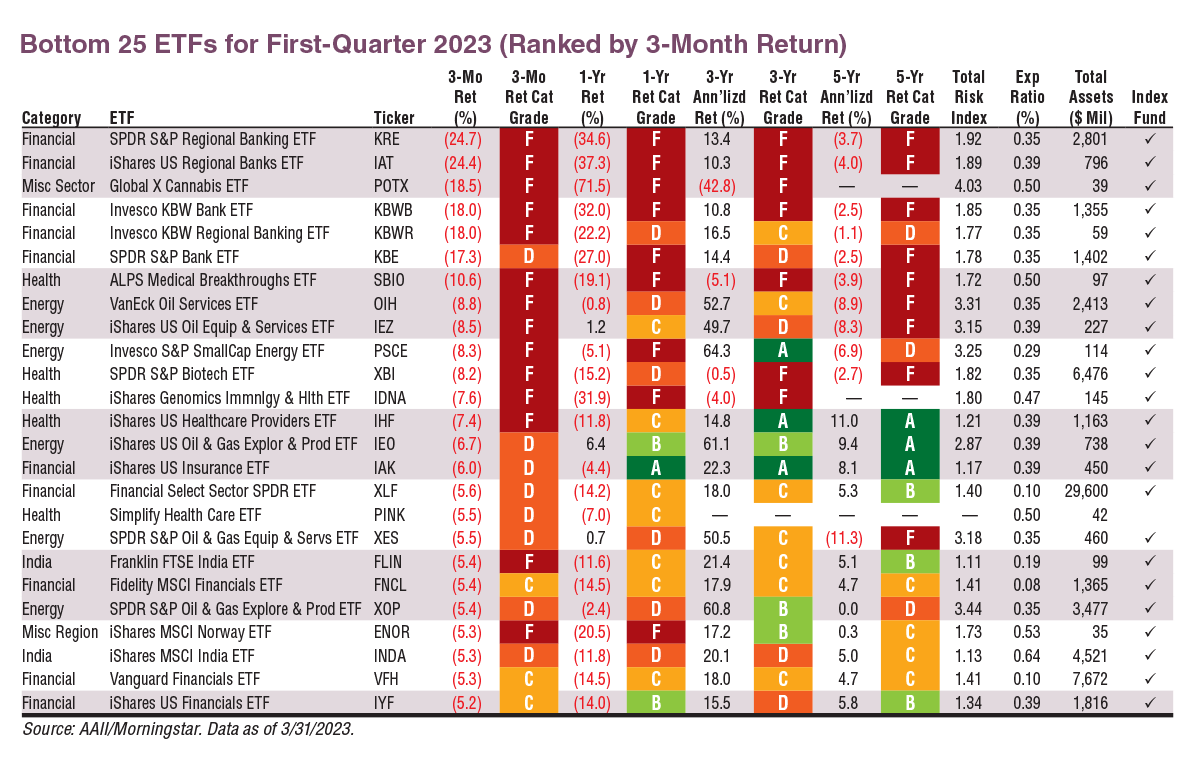
Not all foreign funds are equal or did well. Packed in among the laggards are several foreign country-specific ETFs. The Franklin FTSE India ETF (FLIN) and the iShares MSCI India ETF (INDA) returned –5.4% and –5.3%, respectively, for the first quarter. Another country-specific ETF, the iShares MSCI Norway ETF (ENOR), also had a negative return, posting –5.3%. The Vanguard FTSE Developed Markets ETF (VEA), on the Asset Allocation Models table, is a bit more diversified and returned 7.7% over the same period.
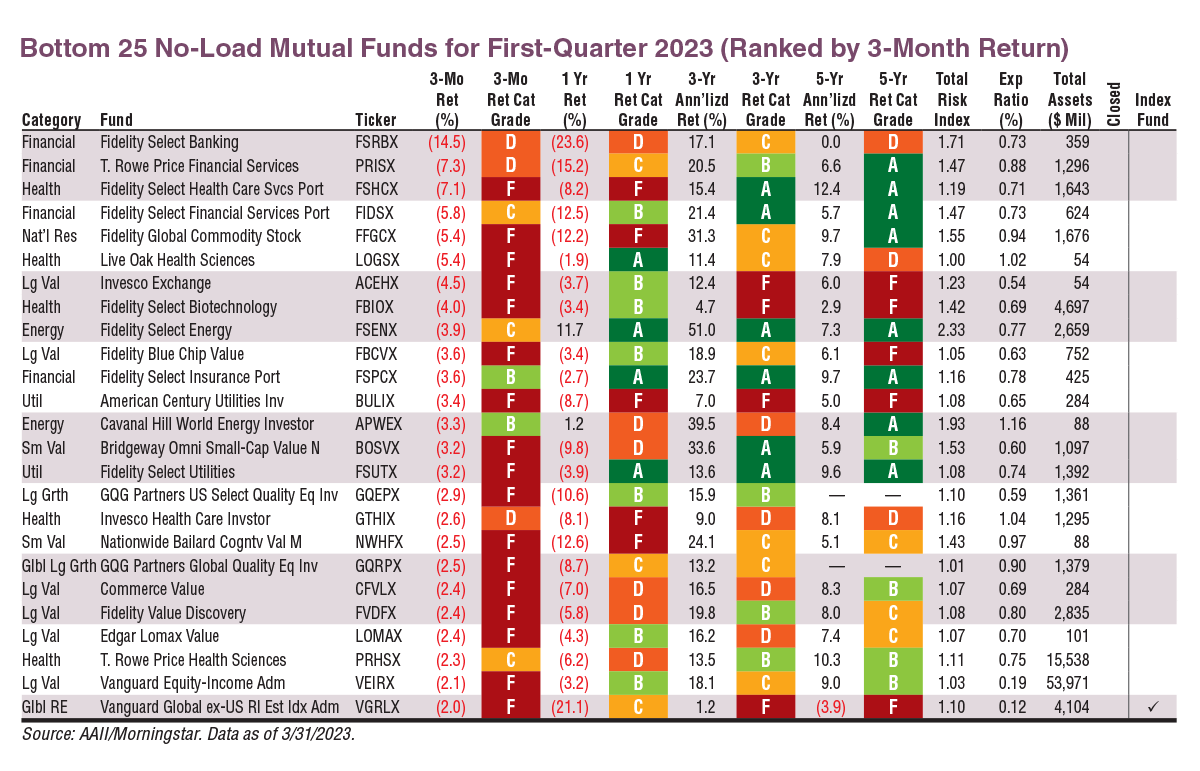
Mutual funds and ETFs heavily concentrated in financials went into the red as the banking crisis sparked concerns about financial stability. The worst-performing mutual fund is the Fidelity Select Banking fund (FSRBX), with a –14.5% first-quarter return, and the worst-performing
ETF is SPDR S&P Regional Banking ETF (KRE), with a –24.7% first-quarter return. Since March, regional banks have reportedly been battling deposit flight. Economic concerns and worries about long-term bonds that devalued significantly have soured sentiment toward these companies. With high exposure to regional banks, SPDR S&P Regional Banking has felt the crunch. Fidelity Select Banking has a large exposure to regional banks while also holding large banking companies like JPMorgan Chase & Co. (JPM).
After being the best-performing sector in 2022, energy funds faltered during the first quarter of 2023. Weakening oil and gas prices contributed to the energy sector’s chill as U.S. recession concerns came to the forefront. The Fidelity Select Energy fund (FSENX) posted a –3.9% quarterly loss, while the VanEck Oil Services ETF (OIH) was down –8.8%.
Fidelity Select Energy continues to lead its category peers, however, with one-, three- and five-year A+ Investor Grades of A. The relative performance for VanEck Oil Services is less impressive with a three-year return grade of C and a five-year return grade of F. These grades imply average and lowest 20% performance, respectively, within its ETF category. Fidelity Select Energy’s largest holdings are ExxonMobil Corp. (XOM) and Chevron Corp. (CVX), while VanEck Oil Services’ largest holdings are Schlumberger N.V. (SLB) and Halliburton Co. (HAL).
Five mutual funds and five ETFs from the health category also appear on their respective bottom performer tables. This also follows what was a good 2022 in terms of relative performance. Weakness among biotechnology companies is the reason.
The Live Oak Health Sciences fund (LOGSX), which fell by 5.4% last quarter, has 26.5% of its portfolio allocated to biotechnology companies. ALPS Medical Breakthroughs ETF (SBIO) is mostly allocated to small- and mid-cap biotech companies; the ETF lost 10.6% last quarter. It also has a high total risk index of 1.72, which reflects an elevated level of volatility. In contrast, Live Oak Health Sciences, which is more diversified in terms of both market cap and industry focus, has a total risk index of 1.00. This risk index implies an average level of volatility relative to all mutual funds.
Investor Professor

PRISM Wealth-Building Process

AAII How-To

BARRY J from TX posted over 3 years ago:
You need to log in as a registered AAII user before commenting.
Log InCreate an account