


Paul Merriman leads a class in AAII's new Essential Investing Video Course. Go to https://www.aaii.com/ves for more information and to subscribe.

Most investors understand the benefits of diversifying their equities beyond just the popular S&P 500 index. But too many of them take only baby steps, in the mistaken belief that a total market fund or a similar international fund will give them the diversification they need.
That’s a recipe for what might be called “pretend diversification.”
Yes, you get some variation from the ubiquitous S&P 500. Your results won’t be a lot different than if you had left all your money in the S&P 500, however. Through September 6, 2023, the most recent 15-year annualized return for the Vanguard 500 Index fund  (VFIAX) is 11.1%. The 15-year annualized return for the Vanguard Total Market Index fund (VTSAX) is 10.9%.
I’m going to discuss at some length an alternative that is much more likely to help long-term investors when it’s put to work diversifying an S&P 500 portfolio. Its higher long-term returns entail surprisingly little extra risk. In some cases, small-cap value stocks can reduce your risk.
Factor Investing With Size and Value
To achieve effective equity diversification, you need to identify one or more asset classes, or groups of stocks that tend to move up and down together.
Sector funds do this. For example, they can take advantage of the fact that technology stocks such as Microsoft Corp. (MSFT) and Apple Inc. (AAPL) will move up and down in reaction to different forces than those of oil stocks like Chevron Corp. (CVX), financial stocks like Bank of America Corp. (BAC) or drug stocks like Bristol-Myers Squibb Co. (BMY).
Academic researchers have identified that the most important U.S. equity asset classes are large-cap blend (which is similar to the S&P 500 and includes growth stocks and value stocks), large-cap value, small-cap blend and small-cap value. Two factors are crucial in this classification.
One is company size. In many periods, small companies move up and down at different times and rates than large companies. For this purpose, a company’s size is commonly measured by its total market capitalization. That is the company’s theoretical value if all its outstanding shares were bought or sold at the current market price.
A second important factor is value. Value is often defined as the price per share in relation to the book value of the company (its net assets). If two companies have identical book values and identical numbers of shares outstanding, the one with the lower price is considered the better value.
Naturally, in real life, it’s a bit more complex than that. But the general idea is that if you can buy similarly strong fundamentals for less money, you are getting a better deal—meaning a better value. Over the long haul, investors have received better returns when they pay less for stocks than when they pay more. This is known as the value premium.
The value premium certainly does not apply to every individual stock. But when you can buy hundreds (or thousands) of companies that sell for low prices relative to underlying fundamentals, you are likely to get higher long-term returns.
When you put these two factors together, you get smaller companies that are relatively underpriced, an asset class known as small-cap value. To start our deep dive into small-cap value returns, Figure 1 shows the long-term performance of the four major U.S. asset classes.
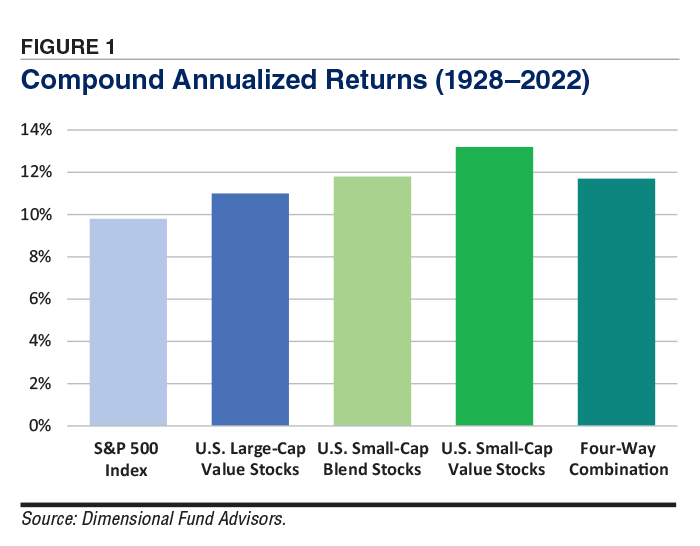
Over a few years, the difference between a return of 9.8% (S&P 500) and 13.2% (small-cap value) may not make a huge difference. Over a period of several decades, the difference can be enormous. Consider this:
- Compounding at 9.8%, $10,000 will grow to $15,959 in five years; at 13.2%, it will grow to $18,588;
- Over 20 years, the difference is $64,870 at 9.8%
- versus $119,379 at 13.2%;
- Compounding over 40 years, the results would be $420,817 versus $1,425,138.
I’m not advocating an equity portfolio made up exclusively of small-cap value stocks, even though the long-term returns of that asset class have been superior and academic research has identified the reasons. The superior performance is expected to continue, although nobody knows how much the premium will be.
Small-cap value stocks often move up and down quite out of sync with major market indexes like the S&P 500. For diversification purposes, that’s a blessing.
If you own only small-cap value stocks, you’ll sometimes find yourself losing ground when “everyone else” seems to be thriving. The late John Bogle, former chairman and CEO of Vanguard, was well aware of small-cap value stocks but wasn’t much of a fan. He believed they require more patience than most investors have.
Every investment adviser and expert I know says the best strategy is the one you will stick with. Bogle and many other experts have said they believe small-cap value stocks are likely to spook many investors into abandoning their strategies.
Small Cap Improves Upon S&P 500 Returns
Here’s what I’m suggesting: Assume your default bedrock equity investment is the familiar, comfortable S&P 500. Also assume that you would like to do better than that index over the long term and you’re willing to put a portion of your equities into another asset class. In that scenario, I think small-cap value is your best choice for diversification.
I can’t show you the future, but I can show the past.
Many investors believe small-cap value stocks are riskier than the S&P 500. Our analysis paints a different picture. We studied 53 years of returns from 1970 through 2022. We compared the S&P 500 alone to an equity portfolio split 50%/50% between the S&P 500 and small-cap value stocks.
Here’s what we found:
- The two-fund combination had a compound annual growth rate of 12.2%, compared with 10.4% for the S&P 500 itself.
- In 11 of the 53 calendar years, the S&P 500 lost money; in three of those losing years, small-cap value stocks realized gains.
- In another five of those 11 years in which the S&P 500 lost money, the two-fund combination also lost money, but not as much as the S&P 500.
- In its 42 profitable years, the S&P 500 was up 18.7% on average; in those same years, the average gain for small-cap value was 21.3%.
In other words, in nearly three out of four of the bad years for the S&P 500, a 50%/50% combo with small-cap value made things better. And in the good times, small-cap value delivered more of what investors want. Plus, the overall compound return difference of 1.8 percentage points can make a huge difference over a lifetime.
Ben Felix, a Canadian researcher who produces some of the best investment videos I’ve ever seen, made a study of the returns of the U.S. Total Market index (pretty similar to the S&P 500) and small-cap value stocks going back to June 1927 and continuing through June 2023. He compared more than 1,000 periods of 120 months each (10 years, in other words) starting on the first of every month.
Felix found that the total market lost money in 145 of these “decades.” In 108 of those periods, small-cap value stocks had positive returns. The total market index’s losses averaged 2.3% in those 108 periods when small-cap value stocks rose. Small-cap value’s gains averaged 6.5% during those periods. Figure 2 shows the returns.

The data is clear: In many cases, adding small-cap value took the sting out of the overall market’s bad times.
Small-Cap Value in Real Life Requires Time and Patience
If you want to dig deeper into how small-cap value stocks are chosen by fund managers, watch Plancorp chief investment officer (CIO) Peter Lazaroff’s interview with Avantis Investors CIO Eduardo Repetto. The Avantis U.S. Small Cap Value ETF (AVUV) is an exchange-traded fund (ETF) we at The Merriman Financial Education Foundation have identified as the “best in class” fund for owning small-cap value stocks. [Editor’s note: This ETF had A+ Investor Grades of A for its one- and three-year returns as of August 31, 2023.]
Repetto gives a lively discussion of factor investing and how investors benefit from owning stocks with lower relative prices. “Price matters,” he says. “When we buy a stock, we are buying future earnings and we are buying the company’s balance sheet … That is what matters. You want to pay as little as possible for that. Paying lower prices is likely to produce higher returns.”
Like most other seasoned investors, Repetto stresses the need for patience, especially with the ups and downs of small-cap value stocks. Referring to short-term gains and losses as “noise,” he said, “If you cannot really deal with that noise, you have to think about how you are going to invest because in the short term, the results will be all over the map.”
He likened the process of investing to “a long journey with bad days and amazing days,” sort of like starting first grade with a goal of getting a doctorate degree. Repetto went on to say, “When I am driving, I hate red lights, but they don’t stop me from getting where I am going … If you expect your long-term return to be 10%, it’s about 0.03% or 0.04% a day. The noise of the market will overwhelm those very small numbers. Your patience must be strong enough to overcome that.”
How Patient Must You Be With Small-Cap Value?
Some investors wonder if they are too old to invest in small-cap value stocks. It’s a good question. It arose during a video I made earlier this year with Chris Pedersen, research director of The Merriman Financial Education Foundation.
Chris cited some figures from Index Fund Advisors, a fee-only advisory and wealth management firm. As it turns out, the longer you hold small-cap value stocks, the more likely they are to outperform the S&P 500.
Based on history, small-cap value stocks beat the S&P 500:
- 50.1% of the time in one-month periods,
- 55.4% of the time in one-year periods,
- 57.9% of the time in three-year periods,
- 61.8% of the time in five-year periods,
- 73.8% of the time in 10-year periods,
- 85.3% of the time in 15-year periods and
- Virtually always (99.7%) in 20-year periods.
In that video, Chris and I were discussing how a small-cap value fund could be used in combination with a target-date retirement fund to provide an extra measure of returns. (That’s not too different from combining small-cap value with the S&P 500.) One conservative way to combine these two is to invest 90% of your money in a target-date fund and the other 10% in small-cap value.
“If somebody asked me for the simplest way to invest, that is what I recommend,” Chris told me. Compared with a target-date fund by itself, the combination “can increase what you have in retirement by about 25% without a lot of additional risk.”
In the video, Chris showed that increasing the small-cap value allocation percentage to 20% could boost an investor’s lifetime benefit by 75% in inflation-adjusted dollars. You might think going from 10% to 20% in small-cap value would involve taking a lot more risk. Chris said that isn’t so. From 1970 through 2022, the worst drawdown wasn’t much greater than that of a target-date fund by itself, as Table 1 shows.

Here are two more interesting comparisons of small-cap value and the S&P 500.
In the 25 years from 1975 through 1999, the S&P 500 had a compound annual growth rate of 17.2%. Meanwhile, an index of small-cap value stocks grew at a rate of 22.3% over the same period.
From 2000 through 2021, the S&P 500 compounded at 7.5%, and small-cap value stocks grew by 10.8%.
Table 2 provides another set of numbers that should be especially interesting to any investor looking at a time horizon of 40 years or more. It shows the results of a study of 55 40-year periods from 1928 through 2022.
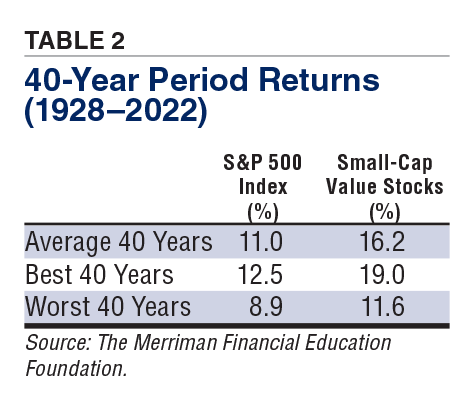
Two things leap out at me from the numbers in Table 2. Even the best long-term return for the S&P 500 was left in the dust by the average return for small-cap value. The worst 40-year period for small-cap value was not far behind the best 40 years for the S&P 500. For anyone with long-term goals, those numbers are certainly worth thinking about.
The Ugly Side of Investing in Small-Cap Value Stocks
Small-cap value investing isn’t entirely a free lunch. To get the full benefit, you need a long-term plan that you believe in enough to maintain it even when recent data makes you think it must be wrong.
With small-cap value stocks, that’s a challenge. Since 1927 there have been four periods, each at least 17 years long, when small-cap value failed to deliver premium results compared to the S&P 500. These were from 1927 to 1944, from 1946 to 1965, from 1983 to 2000 and from 2005 to the present (September 2023). This is what Bogle was referring to when he doubted most investors have enough patience for small-cap value stocks.
Human psychology doesn’t help either. Our brains are wired to make us believe that whatever is happening right now will continue. Despite overwhelming evidence that timing the market isn’t reliable, investors like having their money in what’s recently been doing well.
Whenever small-cap value has been outperforming the S&P 500 for a few years, advisers and salespeople want to jump on the bandwagon. Unfortunately, those eager investors can’t buy past returns. As always with investing, the tide can turn at any time.
These same forces prompt many investors to get nervous and bail out when prices start going down. This can be a recipe for trouble, to say the least. As Repetto said, short-term market “noise” can overwhelm us and wipe out our long-term plans.
Because you have persevered this far, I want to take an even deeper dive and point to another problem with small-cap value stocks: confusion over what their performance has been.
Everyone agrees on the ingredients of the S&P 500. When it comes to small-cap value stocks, investors are confronted with multiple indexes. Each claims to represent the asset class and each has different historical returns.
Table 3 shows 15-year annualized returns for six small-cap value indexes. The difference between the highest and lowest 15-year returns was 2.5 percentage points, a very significant spread for long-term investors.
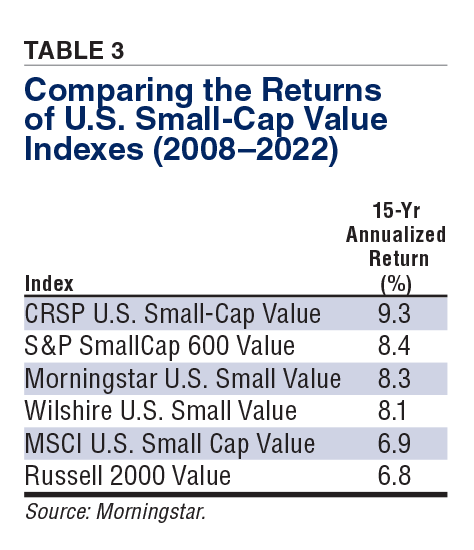
In any single year, the spread can be much wider. In 2009, the Morningstar U.S. Small Value index rose 40.3%, while the Russell 2000 Value index’s gain was “only” 20.6%.
So why all the indexes for a single asset class? Morningstar explained it this way, “Splitting the market into pieces requires making decisions about how each component will be defined. These decisions can be subjective and vary from one instance to the next.”
Because of different definitions of small-cap and value versus growth, various stocks may be included or excluded. In addition, some index managers update or rebalance their holdings annually, some semiannually and some quarterly on “dates that can be arbitrary,” Morningstar wrote.
The Bottom Line on Small-Cap Value
At this point, you may be wondering: What’s the best small-cap value index? While I can’t give you a definitive answer, the figures I have cited in this article are based on the CRSP U.S. Small Cap Value index, which focuses on smaller companies and deeper value discounts. [Editor’s note: The aforementioned actively managed Avantis U.S. Small Cap Equity ETF is benchmarked to the Russell 2000 Value. The Vanguard Small-Cap Value ETF (VBR) tracks the CRSP U.S. Small Cap Value index.]
At the end of the day, I strongly believe small-cap value stocks are a very worthwhile addition to any long-term portfolio anchored by the S&P 500.

Related

Portfolio Strategies
Tilting AAII's Asset Allocation Models to Match Your Growth or Value Style
Related

Portfolio Strategies
Meaningful Diversification Can Lead to Higher Returns
Discussion
FREE REPORT

Get your free copy of our special
report analyzing the tech stocks
most likely to outperform the
market.
THEODIS P from NC posted over 2 years ago:
BRUCE B from MA posted over 2 years ago:
BARRY J from TX posted over 2 years ago:
MANJUNATH S from CA posted over 2 years ago:
JOHN D from LA posted over 2 years ago:
Robert R from TX posted over 2 years ago:
JOHN L from NJ posted over 2 years ago:
THOMAS D from VA posted over 2 years ago:
ROBERT A from NC posted over 2 years ago:
ROBERT A from NC posted over 2 years ago:
RICHARD J from WI posted over 2 years ago:
RICHARD J from WI posted over 2 years ago:
JAMES L from TN posted over 2 years ago:
CHARLES B from WA posted over 2 years ago:
MICHAEL W from NY posted over 1 year ago:
You need to log in as a registered AAII user before commenting.
Log InCreate an account