

The CAPE Ratio Is High but not Pricey
by AAII Staff | December 03, 2020
The cyclically adjusted price-to-earnings (CAPE) ratio extended its rebound from its March low, reaching 33.1 in November. Followers of the traditional CAPE ratio will regard the November level as high. They would be justified in doing so. Previously, the ratio has only been above 30 in the 1920s and in early 2000.
Adherents to absolute valuations pay attention solely to the current number. Those who use a relative valuation approach attempt to consider valuation ratios within context. For the CAPE ratio, one point of context is how it compares to bond yields.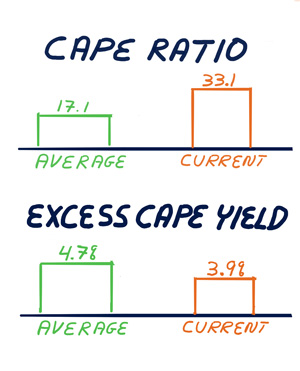
Nobel laureate Robert Shiller, who created the CAPE ratio, co-authored a Barclays report with Laurence Black of The Index Standard and Farouk Jivraj of Barclays offering context. They cited low interest rates as pushing up valuations. They further described equities as appearing “highly attractive” relative to bonds.
The CAPE ratio is a long-term, inflation-adjusted price-earnings (P/E) ratio. For the U.S. markets, it measures the S&P 500 index against inflation-adjusted earnings for the past 10 years. Since 1880, it has ranged between 4.8 and 44.2 with an average value of 17.1. The ratio fell to a multi-year low of 24.82 in March as the stock market bottomed in response to the coronavirus pandemic.
A newer measure shows the ratio as being less pricey. The excess CAPE yield adjusts for long-term interest rates. It is the inverse of the current CAPE ratio (1 ÷ CAPE) minus the real (inflation-adjusted) 10-year interest rate. Inversing the CAPE ratio creates a long-term, inflation-adjusted earnings yield. It is akin to the traditional earnings yield (earnings for the last four quarters divided by price, or E/P) that is used to compare stocks to bonds.
Based on this measure, stock valuations are well within historical norms. The November excess CAPE yield of 3.9% is between the historical average of 4.7% and the historical median of 3.5%. For those who are curious, the ratio has gone negative before. The last such time was between May 1999 and November 2000. A negative excess CAPE yield suggests that bonds have more upside than stocks. (Historical data for both the CAPE ratio and the excess CAPE yield can be found on Robert Shiller’s website.)
Shiller and his co-authors think the excess CAPE yield can explain investors’ current preference for stocks beyond the fear of missing out (FOMO) and work-from-home themes. “Investors may believe equities can offer better potential for positive real returns over the next-best-risky alternative of long-term bonds,” explained the trio in the Barclays report.
As far as what this means going forward, I’ll refer you to a Project Syndicate article the trio published this past weekend. In it, they wrote, “Eventually, down the line, bond yields may just rise and equity valuations may also have to reset alongside yields. But at this point, despite the risks and the high CAPE ratios, stock market valuations may not be as absurd as some people think.”

- Robert Shiller explained why he looks at 10 years of earnings and the importance of factoring in inflation when valuing assets in this 2013 AAII Journal article.
- For those wanting to consider other market valuation measures, take a look at “Three Value-Investing Benchmarks.” The data is from the 2017 publication date, but you can use the formulas to calculate updated valuations.
- December brings our annual tax guide; the updated 2020 edition is now online.
- I’ll discuss what the changes to the tax code mean for individual investors on Wednesday at 7:30 p.m. CST. Click on the link to register for the webinar.
- The December AAII Journal also lists 17 financial and investing moves you can take before the year’s end.
The percentage of individual investors describing their short-term outlook as “bearish” is at an 11-month low in the latest AAII Sentiment Survey. The latest AAII Sentiment Survey also shows optimism rebounding back to an unusually high level.
Bullish sentiment, expectations that stock prices will rise over the next six months, rose 1.8 percentage points to 49.1%. Optimism is above its historical average of 38.0% for the fourth consecutive week.
Neutral sentiment, expectations that stock prices will stay essentially unchanged over the next six months, rose 3.0 percentage points to 28.3%. Even with the increase, neutral sentiment remains below its historical average of 31.5% for the 45th time out of the past 47 weeks.
Bearish sentiment, expectations that stock prices will fall over the next six months, declined 4.8 percentage points to 22.7%. Pessimism was last lower on January 1, 2020 (21.9%). Pessimism is below its historical average of 30.5% for the fourth consecutive week.
As noted above, bullish sentiment is back at an unusually high level (more than one standard deviation above its historical average). Historically, such readings have been followed by lower-than-average six- and 12-month returns by the S&P 500 index. Given the possibility of coronavirus vaccines soon being available, the historical trends may not be repeated.
Pessimism is near the bottom of its typical range. The breakpoint between typical and unusually low readings is 21%.
The positive results from Pfizer’s and Moderna’s late-stage trials for the coronavirus vaccine have made many individual investors either more optimistic or, at least, less pessimistic. Concern about the shorter-term trends in coronavirus cases and the resulting economic impact remain, however. Also influencing individual investors’ sentiment are the results of the recent election, valuations and interest rates.
Over the holiday week, we asked AAII members what their favorite thing to eat on Thanksgiving was. Turkey was the most popular, followed by stuffing and gravy.
For this week’s special question, we asked AAII members how they think the average consumer is faring relative to a year ago. More than half of respondents (56%) say that the average consumer is faring worse relative to a year ago due to coronavirus-related economic slowdown, unemployment and declines in spending. This compares to about 30% of respondents who say that while the average consumer is doing fairly well if they are employed, others who have lost their job are doing substantially worse. In addition, about 14% of respondents say that the average consumer is faring about the same compared to last year.
Here is a sampling of the responses:
- “There are extremes: If you are still working, everything is fine—financially speaking. If you are unemployed, you are facing financial destruction on January 1. All of the government support programs expire, and it doesn’t look likely that the lame duck Congress will do anything before the inauguration.”
- “Very well if you’re working; however, a lot of people are still out of work or not working full time. The big hurdle is to get travel, leisure and restaurants back into production. A lot of people have been left out of recovery.”
- “On average, things are worse now than a year ago. With some people unemployed and others on reduced work hours, they are a drag on the economy, in spite of the record stock market. Wealthy and retired people are better off now, but the average consumer is worse.”
- “There is no such thing as ‘the average consumer.’ It all depends on your job and income status. Those who have been laid off due to the coronavirus will probably cut spending as much as possible until they see the recovery due to vaccinations being given. I think that when vaccinations are widely available, there will be a surge in pent-up spending not only for consumer goods but all services and travel.”
- “Likely the average consumer suffered job/income issues and is worse off today than a year ago. For retirees (like me), the impact of the coronavirus has been minimal, and the stock market rise has been very favorable.”

Bullish: 49.1%, up 1.8 points
Neutral: 28.3%, up 3.0 points
Bearish: 22.7%, down 4.8 points
Bullish: 38.5%
Neutral: 31.0%
Bearish: 30.5%
AAII Asset Allocation Survey
Individual investors’ exposure to equities hit a four-month low in November according to the latest AAII Asset Allocation Survey. Allocations to cash and fixed income both increased.
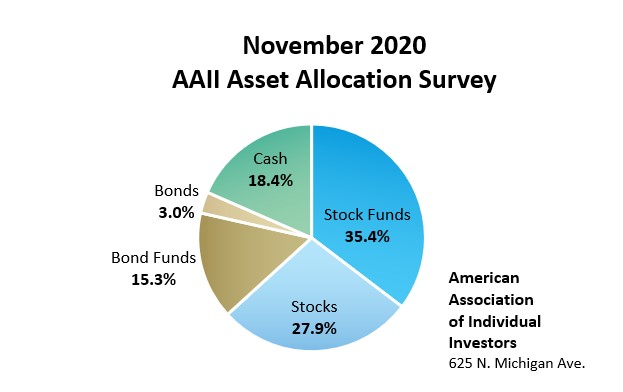
Stock and stock fund allocations decreased by 2.6 percentage points to 63.2%. Equity allocations were last lower in July 2020 (62.2%). This marks the sixth consecutive month and the eighth month since the start of 2020 that stock and stock fund allocations are above their historical average of 61%.
Bond and bond fund allocations increased by 1.5 percentage points to 18.3%. This is the 21st consecutive month and the 22nd month since the start of 2019 that fixed-income exposure is above its historical average of 16.0%.
Cash allocations rose 0.9 percentage points to 18.4%. The last time cash allocations were at their historical average of 23.0% was in April 2020.
Optimism about the short-term direction of the stock market, as measured by our weekly Sentiment Survey, was significantly higher in November as positive news about vaccines was released. This did not translate to higher equity exposure as many of our members take a long-term approach to portfolio allocation.
Though exposure to stocks and stock funds was lower in November, it was similar to what we’ve seen over the past several months. Since June, equity exposure has fluctuated between 62.2% and 65.8%.
November AAII Asset Allocation results:
- Stocks and Stock Funds: 63.2%, down 2.6 percentage points
- Bonds and Bond Funds: 18.3%, up 1.5 percentage points
- Cash: 18.4%, down 0.9 percentage points
November AAII Asset Allocation details:
- Stocks: 27.9%, down 2.8% percentage points
- Stocks Funds: 35.4%, up 0.2% percentage points
- Bonds: 3.0%, up 0.1 percentage points
- Bond Funds: 15.3%, up 1.5 percentage points
Historical Averages:
- Stocks/Stock Funds: 61.0%
- Bonds/Bond Funds: 16.0%
- Cash: 23.0%
The numbers are rounded and may not add up to 100%.
The AAII Asset Allocation Survey has been conducted monthly since November 1987 and asks AAII members what percentage of their portfolios are allocated to stocks, stock funds, bonds, bond funds and cash. The survey and its results are available online at: www.aaii.com/investor-surveys.
- Stocks and Stock Funds: 63.2%, down 2.5 percentage points
- Bonds and Bond Funds: 18.3%, up 1.6 percentage points
- Cash: 18.4%, up 1.0 percentage points
- Stocks: 27.9%, down 2.8 percentage points
- Stocks Funds: 35.4%, up 0.2 percentage points
- Bonds: 3.0%, up 0.1 percentage points
- Bond Funds: 15.3%, up 1.5 percentage points
- Stocks/Stock Funds: 62.0%
- Bonds/Bond Funds: 16.0%
- Cash: 22.0%
Take the Asset Allocation Survey.
November 26, 2020 Reasons for Individual Investors to Be Grateful in 2020
November 19, 2020 The Three Levers for Growing Retirement Savings
November 12, 2020 The Travel Stocks I Bought Early in the Coronavirus Pandemic
November 5, 2020 Summarizing Your Investing Plan

Discussion
No comments have been added yet. Add your thoughts to the discussion!
You need to log in as a registered AAII user before commenting.
Create an account