

The Three Levers for Growing Retirement Savings
by Charles Rotblut | November 19, 2020
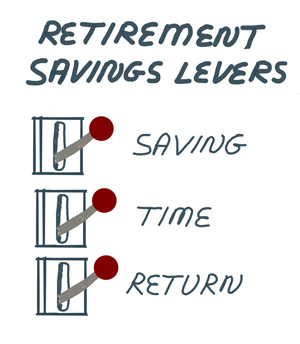
Saving for retirement (or any other goal) requires making use of three levers: saving, time and returns. Each impacts how much wealth you will have to fund retirement. They are all levers you can pull as well as levers you do not have full control over.
To illustrate how they work together, I use a hypothetical person. We’ll assume they have $100,000 saved, earn $70,000 per year and are saving 7% of their salary each year. We can call this person the average Joe because he approximates the average participant in defined-contribution plans [e.g., 401(k) plans], according to Vanguard. We’ll further assume that Joe is 25 years away from retirement, is targeting an average annual return of 8% and is anticipating the amount set aside for retirement to increase by 2% each year (based on his expectations for average salary increases). The employer match is a simplistic 30% of total contributions.
Based on these assumptions, Joe will have $1.24 million saved at retirement.
Now let’s start pulling those levers. The first lever is his savings rate. If Joe were to save 10% of his salary, instead of 7%, he would have $1.47 million at retirement. At a 15% rate, his savings would be nearly $1.87 million. Joe’s ability to increase how much he saves will obviously be dependent on how much income he can avoid spending. This, in turn, is influenced by his salary. Having more disposable income available makes it easier to save more.
In an alternate universe, Joe keeps his savings rate unchanged at 7% but instead postpones retirement by five years. This would result in him having $1.88 million in savings as well. The reason this approximately matches doubling his savings rate is because the extra five years of compounded growth occurs on a base of $1.24 million. In other words, he has a much larger portfolio to benefit from additional growth.
Now let’s pull the return lever instead. In this universe, the savings rate is kept at 7% and his time to retirement is kept at 25 years. The only change is Joe realizing a 10% annualized return instead of an 8% return. His balance at retirement would be $1.82 million.
While the savings rate would require the proportionately biggest relative change to achieve the same result for someone Joe’s age, it’s still arguably the most important. The higher the savings rate is earlier in one’s career, the more money there is to grow over time. A higher savings rate also provides a bigger buffer against market downturns and periods when contributions may be interrupted (e.g., due to a job loss).
Delaying retirement brings the added benefit of bigger Social Security benefits if claiming is also delayed. It is dependent on a person’s health and job security. If Joe was forced to retire sooner than planned, he would lose out on some of the late-in-career portfolio growth.
Returns can be boosted by adopting and sticking to a more aggressive allocation. Returns are a wildcard because investors don’t get to choose the market conditions they live through. A subpar period of returns would hurt Joe’s outcome. An above-average period of returns could give Joe the financial flexibility of retiring sooner than expected.
Pulling all three levers would have the biggest impact. Joe would have more savings to grow, a longer period to grow his savings and potentially higher returns to increase in his wealth. Plus, doing so helps prepare Joe for periods when he may have to cut back on savings and/or when returns may be negative. As an added benefit, pulling all three levers increases the odds of Joe reaching his goals ahead of schedule.
You can use our retirement savings worksheet to test different scenarios. We’re adding it to our Individual Investor Wealth-Building Process toolkit. It’s a prototype; if you have feedback, please let us know.
1. Identifying and Prioritizing Your Financial Goals Worksheet
2. Our Revised Risk Tolerance Worksheet
3. A Worksheet for Determining How Your Portfolio Is Managed
4. Financial Account Inventory Worksheet
5. Investment Expense Tracking Worksheet
6. Portfolio Composition & Notes
7. Withdrawal Strategy Worksheet
8. Life Stage Changes Checklist
9. Key Estate Planning Information Worksheet
10. Portfolio Review Checklist
11. Overview of My Wealth-Building Process
12. Retirement Savings Calculator NEW!

- The time lever allows younger investors to benefit more from higher returns, while as investors near retirement, increasing savings has a bigger impact, concluded AAII contributing editor Craig Israelsen.
- A 2014 study suggested an 11% retirement savings rate for low-income households and 16% for high-income households, but the range becomes much larger when age is factored in.
- If your savings are spread across several accounts, having an inventory of all your accounts can help. This month’s AAII Journal InvestoGraphic will help you create one.
- Those of you seeking ideas for how to invest your retirement savings may want to read the Stock Ideas column in the current AAII Journal. My colleague Derek Hageman explains whether following insider trades can help you realize a higher return.
- Last Friday, we posted our November Model Shadow Stock Portfolio Update. If you’d like to be notified when it’s posted, click here to sign up for the email.
The U.S. financial markets will be closed on Thursday for Thanksgiving. Both the stock and bond markets will close early on Friday as well (1:00 p.m. and 2:00 p.m. Eastern Time, respectively). Our offices will be closed on Thursday and Friday. On behalf of everyone at AAII, have a happy and safe Thanksgiving!
Optimism among individual investors about the short-term outlook for stocks pulled back following last week’s big increase. The latest AAII Sentiment Survey also shows a large rebound in neutral sentiment.
Bullish sentiment, expectations that stock prices will rise over the next six months, declined 11.5 percentage points to 44.4%. This is the first time that optimism is above its historical average of 38.0% on consecutive weeks since mid-February.
Neutral sentiment, expectations that stock prices will stay essentially unchanged over the next six months, rose 10.0 percentage points to 29.3%. Even with the increase, neutral sentiment remains below its historical average of 31.5% for the 43rd time out of the past 45 weeks.
Bearish sentiment, expectations that stock prices will fall over the next six months, rose 1.5 percentage points to 26.4%. This is the first time that pessimism is below its historical average of 30.5% on consecutive weeks since mid-February.
All three indicators are now back within their typical historical ranges.
The positive results from Pfizer’s and Moderna’s late-stage trials have made many individual investors either more optimistic or, at least, less pessimistic. Concern about the shorter-term trends in coronavirus cases and the resulting economic impact remain, however. Also influencing individual investors’ sentiment are the outcome of the election, valuations and interest rates.
This week’s special question asked AAII members how the news about Pfizer’s coronavirus vaccine has impacted their outlook for stocks.
Nearly half (48%) of respondents say that Pfizer’s coronavirus vaccine has improved their outlook for stocks. This compares to about 45% of respondents who say that it has little to no impact on their outlook for stocks.
Here is a sampling of the responses:
- “It has reduced the magnitude of my projected downward, but relentless, pressure on stock prices.”
- “I feel better in the very near term, but the coronavirus remains very worrisome for the late fall and winter. Unfortunately, the political transition will not go smoothly which will also add to volatility. I think we will see ups and downs in the markets where overall we stay about even.”
- “Pfizer’s news about a vaccine has given me a little tempered optimism, but we are far from being out of the woods with the coronavirus.”
- “It does not change my neutral to bearish outlook much. Even with a vaccine, there are still serious uncertainties about accessibility and availability of the vaccine to those who require it.”

Bullish: 44.4%, down 11.5 points
Neutral: 29.3%, up 10.0 points
Bearish: 26.4%, up 1.5 points
Bullish: 38.5%
Neutral: 31.0%
Bearish: 30.5%
November 12, 2020 The Travel Stocks I Bought Early in the Coronavirus Pandemic
November 5, 2020 Summarizing Your Investing Plan
October 29, 2020 The Processes I Use for Managing My Portfolio
October 22, 2020 For Portfolio Reviews, Look at Only What You Need To

Discussion
Gary from CA posted over 5 years ago:
3 LEVERS One needs to increase their returns to retire at a reasonable age and lifestyle. There has never been or will there be a 25 year period in marke history that could classified as *a period". Lever one is the classic answer from an advisor--Work Harder! Eugene Fama, Nobel laureate said Momentum is "the market anomaly that is above suspicion." There is a lot of investigation for you to do on Google about investing with momentum. There are new algorithmic technologies using momentum available that are worthy. If you want different results do something different. These 3 levers are as missing current innovations. ...and a solid retirement. Gary
Barry C Johnson from TX posted over 5 years ago:
This article reminds me of Dan Kahneman’s Linda Problem in “Thinking Fast and Slow,” pp. 156-158, (2011). Let’s estimate the baseline probabilities of the existence of the hypothetical “Average Joe” as a proxy to approximate the usefulness of this example to the AAII membership. How many people have a profile like “Average Joe”? Are 40 years old (or under)? Can expect to enjoy lifetime employment at the same company or a series of companies with defined-contribution retirement plans with 30% employer matching? Have no lifetime events that require drawing down their savings due to divorce, health, educating children, assisting elderly family members, or less fortunate family members? Expect to live 25 years without a major economic downturn? The intersection of Venn diagrams of the probabilities of these events is a very small area. Using a coin flip with 50-50 odds to approximate the probabilities for each of these events, that area is .5 x .5 x .5 x .5 x .5 x .5 x .5 x .5 x = approx. 0.4% (or 1 person in 250). In 350,000,000 Americans … there might be 1,400,000 Average Joes out there right now. I wonder how many will read this article or otherwise pay attention to its advice? There’s the rub.
You need to log in as a registered AAII user before commenting.
Create an account