

May Charts of Interest: The Impact Tariffs Are Already Having
by Charles Rotblut | May 22, 2025
It hasn’t taken long for tariffs to make an impact. In this month’s charts of interest, I show you the effects they are having from different perspectives.
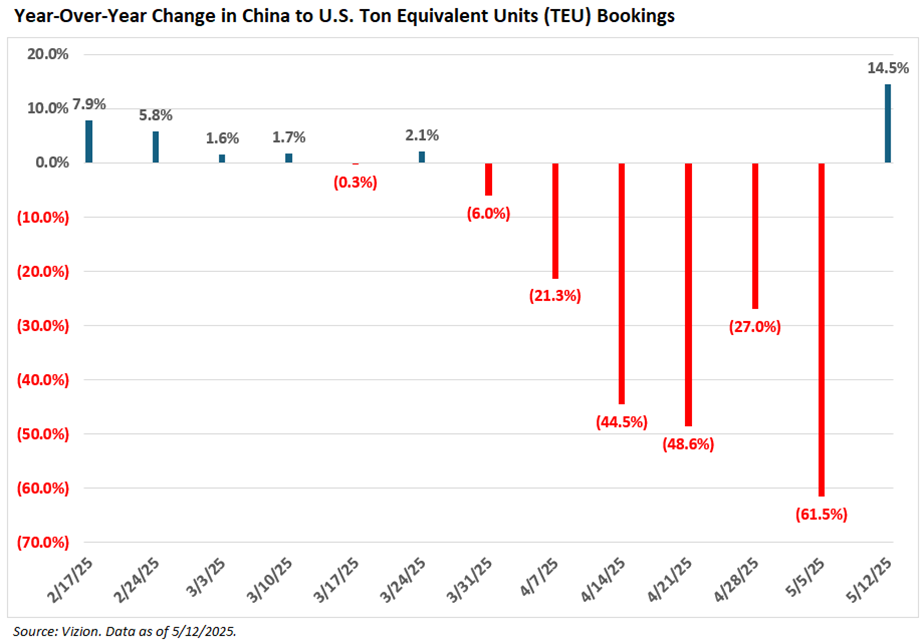
Let’s start with trade. The transport of goods from China to the U.S. has slowed significantly as this year has progressed.
The chart below clearly depicts the drop that occurred after President Donald Trump called for reciprocal tariffs on February 13. It is based on data from Vizion showing the weekly change in China to U.S. bookings.
Not shown on the chart is the 538.3% surge in bookings for the week of February 10. This weekly jump occurred as companies rushed to bring goods into the U.S. before higher tariffs were announced. On May 12, the U.S. and China agreed to lower tariffs for 90 days.
Unsurprisingly, Customs Duties Collected Have Surged
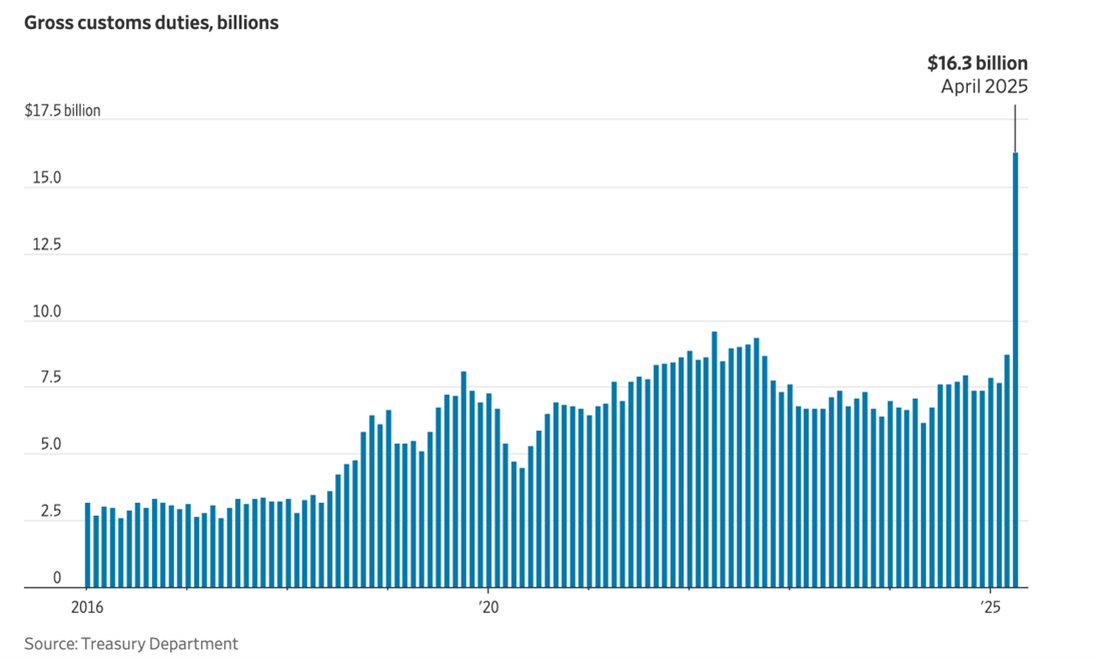
The U.S. Department of the Treasury collected $16.30 billion in customs duties last month, nearly double the $8.75 billion collected in March. The across-the-board tariffs implemented by President Trump were the reason. The chart below is from The Wall Street Journal.
Tariffs Are Keeping Consumers in a Somber Mood
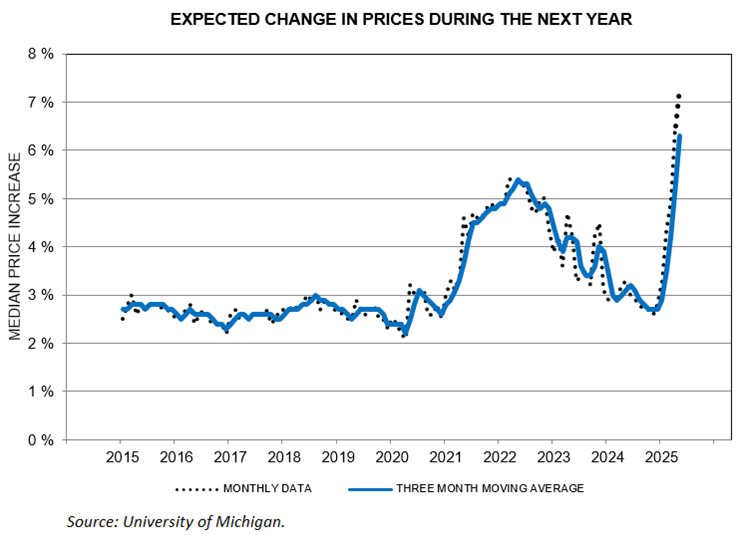
“Tariffs were spontaneously mentioned by nearly three-quarters of consumers, up from almost 60% in April,” stated University of Michigan Surveys of Consumers director Joanne Hsu in the preliminary May Survey of Consumers announcement. Hsu added, “Uncertainty over trade policy continues to dominate consumers’ thinking about the economy.”
Consumer sentiment declined 1.4% on a month-over-month basis in the preliminary University of Michigan consumer sentiment survey. Year-ahead inflation expectations surged from 6.5% in April to 7.3% in May, reflecting worsening concerns.
Tariffs Are the Talk of the Calls
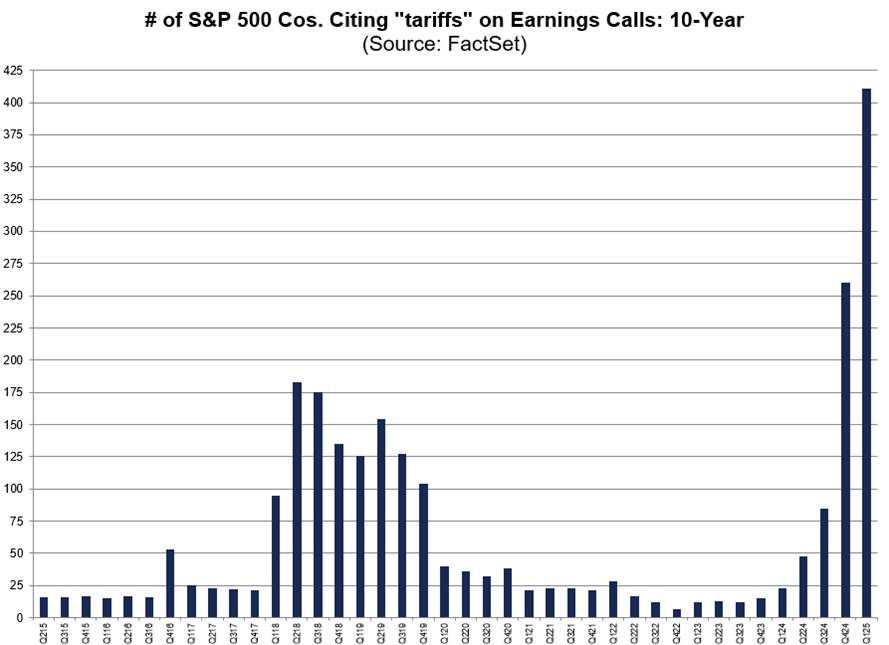
FactSet counted the terms “tariff” or “tariffs” as being cited on 91% of the 451 earnings calls conducted by S&P 500 index companies between March 15 and May 15. This is the highest number of mentions in the past 10 years.
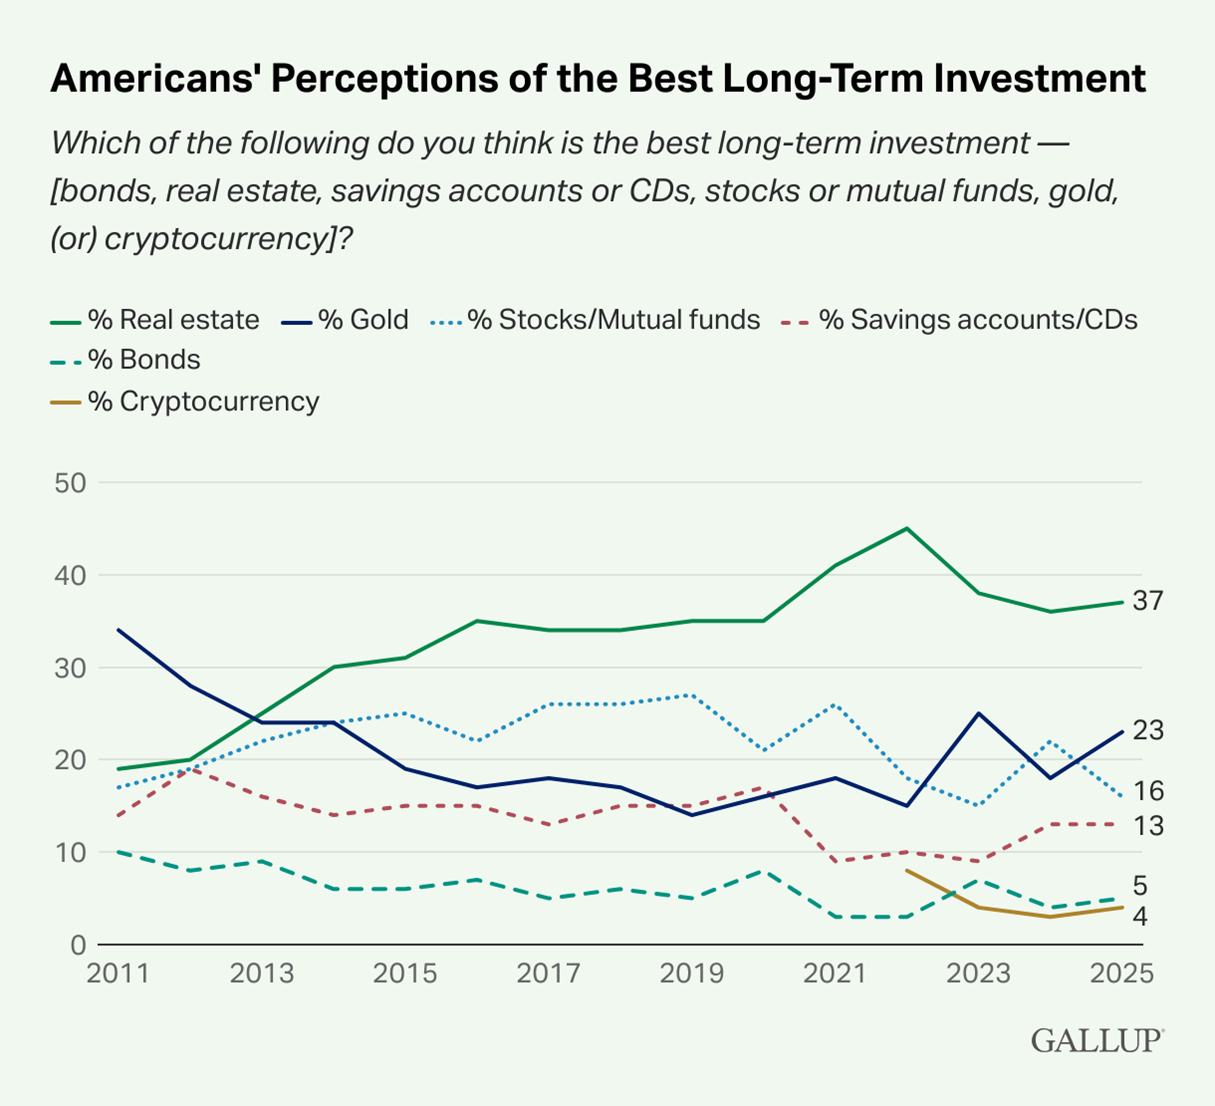
The Best Investment? Gallup Says Real Estate, Then Gold
For the 12th consecutive year, Americans told Gallup that real estate is the best long-term investment. Gold made a resurgence into second place. Prices of the precious metal have been setting new record highs.
Income played a role. Households earning less than $50,000 per year favored gold as the second-best asset (27%), while those earning $100,000 or more per year favored stocks (21%) over gold (17%).
That’s Not Long-Term Investing
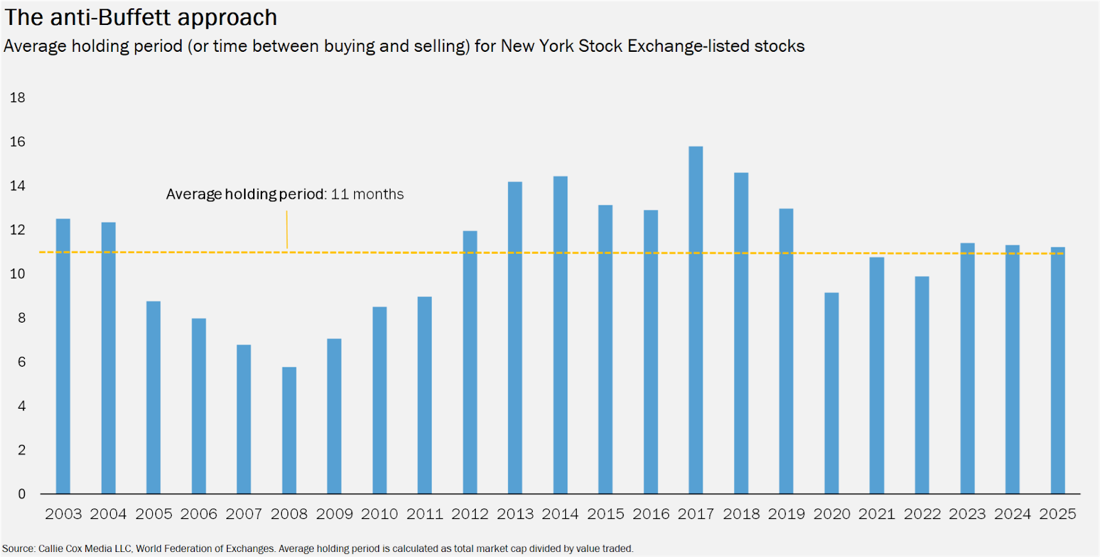
The holding period for stocks listed on the New York Stock Exchange (NYSE) “has averaged less than 12 months for much of the past two decades,” observes Callie Cox of Ritholtz Wealth Management. Various factors contribute to this trend, including active trading strategies, rebalancing by quantitatively driven exchange-traded funds (ETFs), turnover by active mutual fund managers and, yes, even individual investors who trade more frequently than they should.

-
How Conference Calls Can Help Investors Read the Tea Leaves
Corporate conference calls are open to the public, and you can obtain the same unfiltered information as the institutions. -
Comparing and Contrasting Real Estate Funds
Mutual funds and ETFs provide a low-cost entry point to real estate and allow investment in a variety of real estate markets. -
Moving Your Retirement Savings: The Basics of Rollovers
The May 2025 AAII Journal outlines the rules of retirement account rollovers to help you steer clear of unnecessary taxes and penalties.
AAII Sentiment Survey
Pessimism among individual investors about the short-term outlook for stocks decreased in the latest AAII Sentiment Survey. Meanwhile, optimism and neutral sentiment increased.
Bullish sentiment, expectations that stock prices will rise over the next six months, increased 1.8 percentage points to 37.7%. Bullish sentiment is above its historical average of 37.5% for the first time in 16 weeks and is above 30% for only the seventh time this year. Bullish sentiment was last higher on January 30, 2025 (41.0%).
Neutral sentiment, expectations that stock prices will stay essentially unchanged over the next six months, increased 5.9 percentage points to 25.6%. Neutral sentiment is below its historical average of 31.5% for the 44th time in 46 weeks.
Bearish sentiment, expectations that stock prices will fall over the next six months, decreased 7.7 percentage points to 36.7%. Bearish sentiment is above its historical average of 31.0% for the 25th time in 27 weeks. Bearish sentiment was last lower on January 30, 2025 (34.0%).
The bull-bear spread (bullish minus bearish sentiment) increased 9.5 percentage points to 1.0%. The bull-bear spread is below its historical average of 6.5% for the 20th time in 22 weeks.
This week’s special question asked AAII members how they would describe the updated earnings guidance given by companies during the first-quarter 2025 earnings season.
Here is how they responded:
- Better than I expected: 28.2%
- Approximately what I expected: 41.7%
- Worse than I expected: 11.5%
- Not sure/no opinion: 18.3%
Bullish: 37.7%, up 1.8 points
Neutral: 25.6%, up 5.9 points
Bearish: 36.7%, down 7.7 points
Bullish: 37.5%
Neutral: 31.5%
Bearish: 31.0%
See more Sentiment Survey results.

May 15, 2025 Flat but Furious: The S&P 500's Volatile Start to 2025
May 8, 2025 My Six Key Lessons From Warren Buffett
May 1, 2025 Five Moves to Stay Calm When the Market Isn't
April 24, 2025 April Charts of Interest: The Bond Market Gets Jittery

Discussion
Barry from TX posted over 1 year ago:
Charles, #1 Thanks for steering me to the Gallup survey data that portrays investor investing preferences as changing only modestly despite the April 2025 spikes when the tariff/trade data spiked in response to DT2's 04/02 tariff-based "Liberation Day" come out bid and the ROW's "two no trump" 04/19. #2 The BIG DATA in the LT Gallup polls are that (1) a steady 60% of US HHs invest in stocks, although they get distracted by "bright shiny objects" like gold, and (2) 60% participate in retirement funds -- SD 401(k) and/or IRAs. #3 "60/40" allocations seem to be a "naturally recurring" distribution of saving and investing for US HHs with income streams in the upper 40% of the US population. #4 Wifredo Pareto's century-old data continues to describe the distribution of wealth in advanced countries despite 5 generations of income redistribution programs, also, a well-known 60/40 Pareto prediction. #5 These recurring 60/40 distributions qualify as Power Laws, another Pareto finding/prediction that Benoit Mandelbrot attributed to Pareto in 1961 when he first challenged Markowitz's use of the Gaussian "normal distribution" as a "weak fit" as a model for modern portfolio theory management and its related dependence on variance as a measure of "risk" and covariance as a measurement for "mean-variance optimization" diversification.
Barry from TX posted over 1 year ago:
I found this May 19, 2025 article by Jeffrey Ptak, a CFA at Morningstar, titled "This Fund Followed the Rules. That Was the Problem" The "title" IS the link. They created several Pacer Trendpilot ETFs to time SPX by buying/selling based on SPX 200DSMA trends. It hasn’t gone well. Good data and very interesting lessons here.
Barry from TX posted over 1 year ago:
I just read an article from the DFW Fed that #1 discusses the magnitude of the DISTORTIONS in economic data due to DISTORTED sector GROWTH reported in the Fed Biege Books since Covid (2023-2025). #2 It also RECHARACTERIZED forward-looking economic data for 3Q25 and 4Q25 due to continuing bifurcated DISTORTIONS of GROWTH among the 11 sectors. #3 Quoting "the industry representation can drive a divergence between the Beige Book and other measures of US economic growth when growth is concentrated in sectors with no or little Beige Book coverage." #4 It also characterizes some of the prior Biege Book data as being DISTORTED by some of the lay (vs professional) contributors that Beige Books use to report/forecast US economic data. #5 The Fed releases 8 Biege Books each year just before each FOMC meeting, where the FOMC recalibrates/sets the FFR (primary) interest rate. #6 The FOMC has met 2 times YTD -- Jan 28-29 and Mar 18-19 where FOMC punted each time on lowering the FFR to stimulate the economy (and markets.) #7 There will be 6 more FOMC meetings in 2025 - May 6-7, Jun 17-18 [2Q25], Jul 29-30, Sep 16-17 [3Q25], Oct 28-29, and Dec 9-10 [4Q25]. #8 Connecting the ink dots in this government Rorschach suggests that (#1) post-COVID (2023-2025) economic growth has been skewed by several sectors that exhibited weak or no growth from 06/22-12/24 – MFG, RET, FIN --higher GROWTH sectors of the 11 total GICS sectors – CONS/RE, MFG, and RETL (53% of total), and 3 dominant growth sectors (collectively 53% of US GDP) -- ED/HC, GOVT, UTL (15% of total), leaving the other 5 sectors at 32%/average 6%. #9 Sector bifurcation may influence future market performance due to differing base rates. #10 Here is the link to this article to enter in Google -- "Has the Beige Book become disconnected from economic data? - Dallasfed.org"
You need to log in as a registered AAII user before commenting.
Create an account