

April Charts of Interest: The Bond Market Gets Jittery
by Charles Rotblut | April 24, 2025
Though much of the focus as of late has been on the stock market’s volatility, the bond market has incurred its own rumble in the jungle. This month’s charts of interest covers the bond market, inflation expectations and the housing market before moving onto trade (yes, that five-letter word) and the U.S. stock market. Buckle up—the ride could get bumpy.
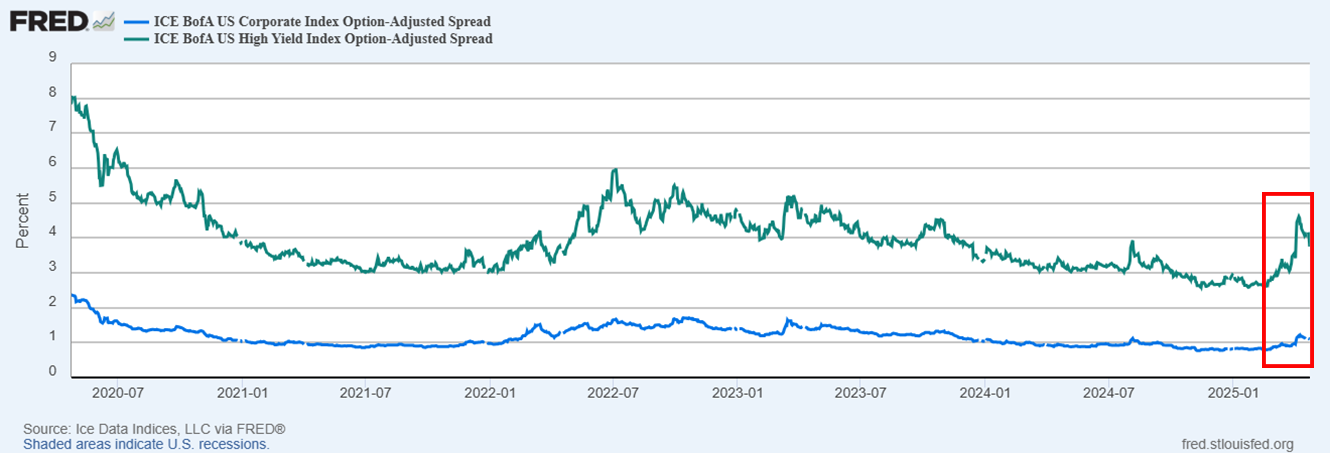
Credit spreads have widened for both investment-grade bonds and high-yield bonds. Credit spread is the difference in yield between a higher-quality bond and a lower-quality bond.
The chart below from the St. Louis Federal Reserve shows the trend in credit spreads between U.S. Treasuries and investment-grade bonds (the blue line) and between U.S. Treasuries and high-yield bonds (the green line). The recent widening reflects uncertainty about future cash flows caused by the recent tariff announcements—particularly for the riskiest bonds. Higher yields increase borrowing costs.
Consumers Are Anticipating Stronger Inflation
Last week, the New York Federal Reserve’s March Survey of Consumer Expectations showed an increase of one half of a percentage point in median one-year-ahead inflation expectations. Consumers now expect inflation to be 3.6% instead of 3.1%.
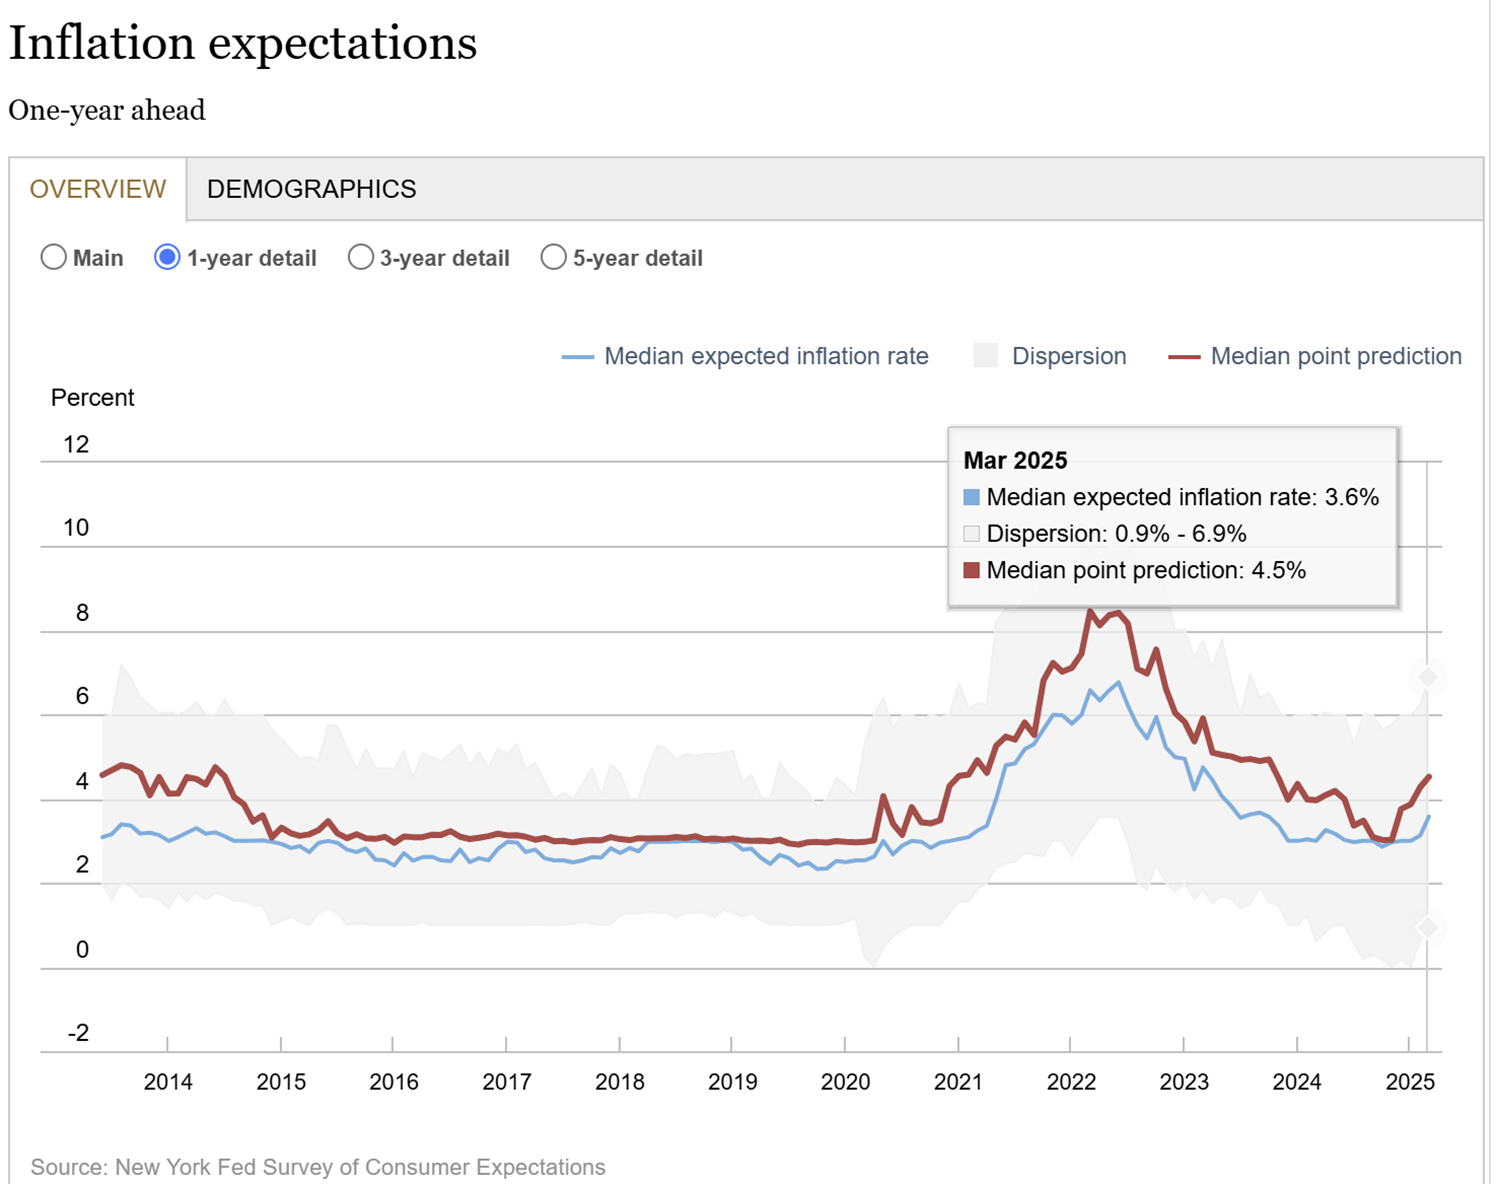
This follows last month’s consumer sentiment survey by the University of Michigan, which reported the largest month-over-month increase in long-run inflation expectations since 1993. The University of Michigan’s final April survey results will be released tomorrow.
The Housing Market Is Showing Signs of Slowing
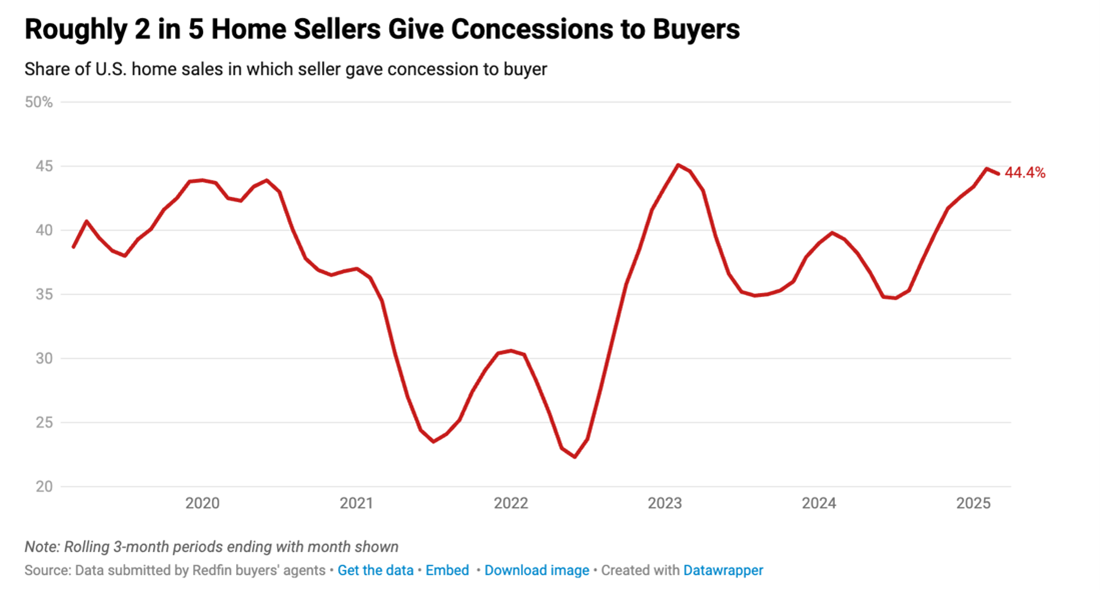
“More sellers are offering concessions as rising housing costs and economic uncertainty make buyers nervous, and housing supply hits a five-year high,” wrote Redfin’s Lily Katz. Listings are also at a five-year high, while mortgage rates remain at elevated levels. As always, real estate is local.
We Do a Lot of Trade With China
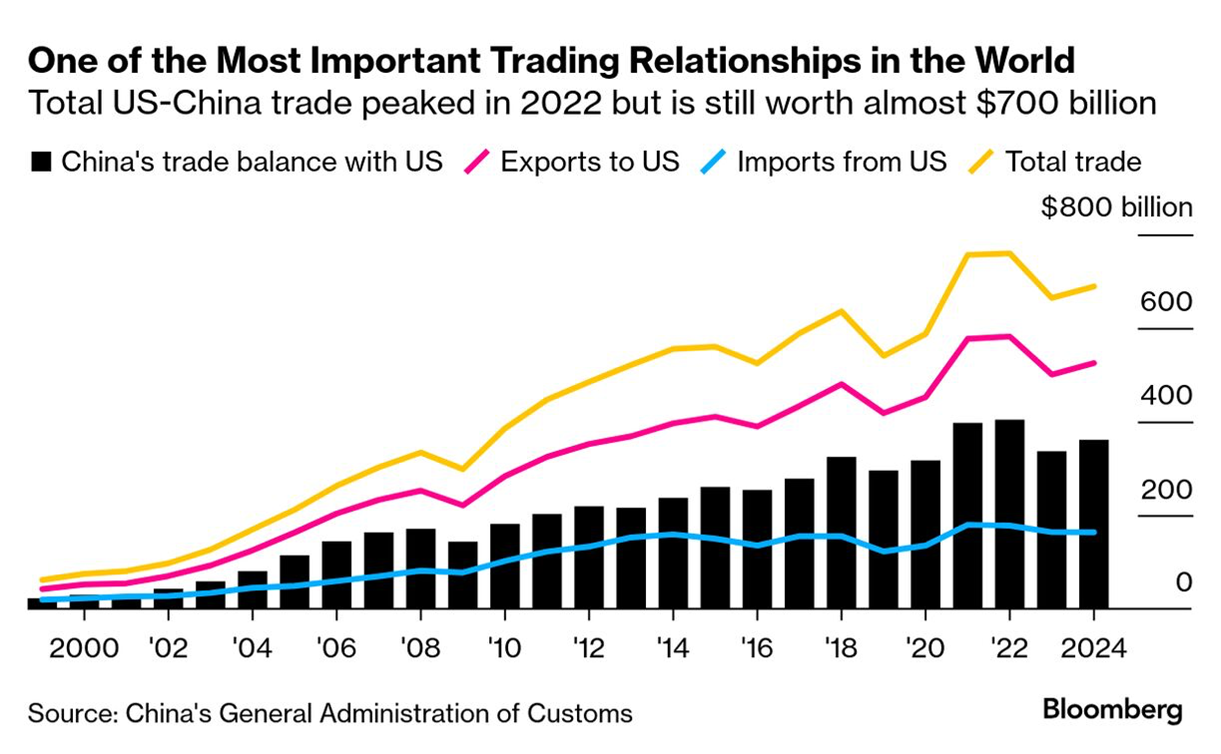
The U.S. imports a lot from and exports a lot to China. Altogether, trade with China is worth $700 billion. Tariffs now exceed 100% on both sides, noted Bloomberg.
There is no question about there being concerns with China that need to be addressed: intellectual property theft, favoritism toward state-owned enterprises, human rights violations, etc. Nonetheless, a prolonged and severe trade war would have adverse economic implications on both sides of the Pacific Ocean.
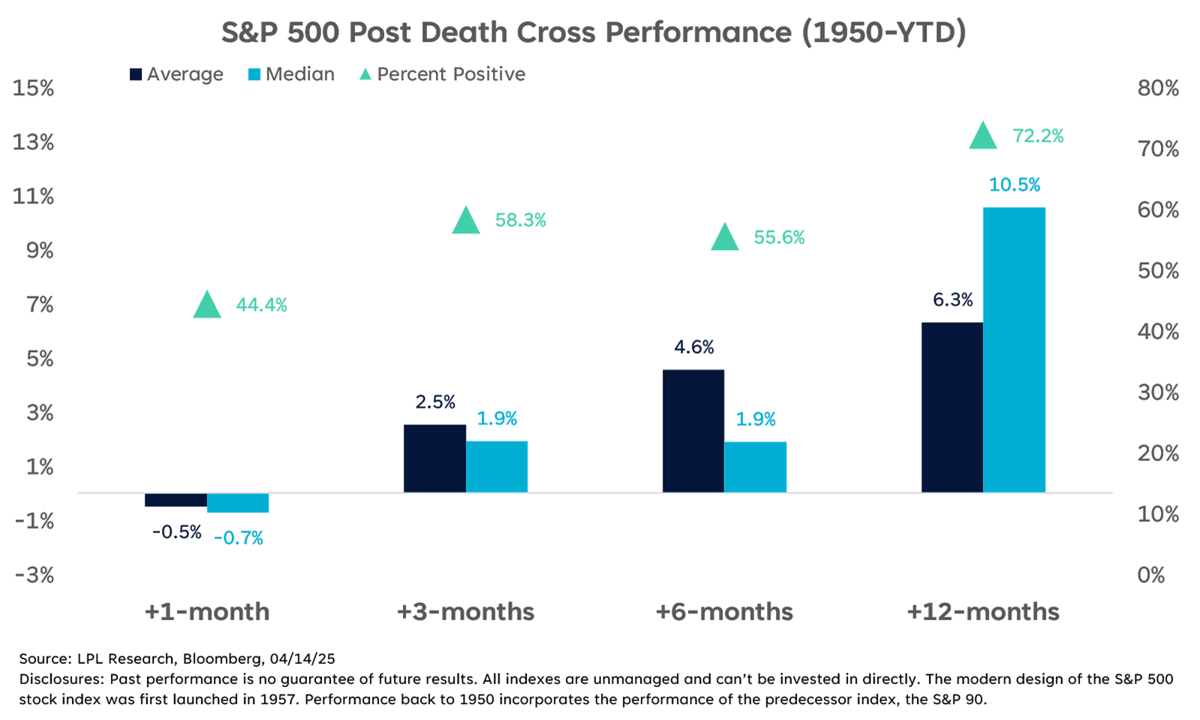
S&P 500 to Investors: “I’m Not Dead Yet”
Early this month, a “death cross” formed on S&P 500 index charts. A death cross occurs when the index’s 50-day moving average (an intermediate trend line) crosses below its 200-day moving average (a longer-term trend line).
As ominous as this chart formation’s name may sound, it often turns out to be about as scary as Mike Wazowski from “Monsters, Inc.” “While this indicator has triggered some well-timed signals (March 2022, early December 2018, December 2007, October 2000), there have been plenty of late ones (including late March 2020). Interestingly, data shows that the S&P 500 has averaged a 6.3% gain in the 12 months following a death cross,” tweeted LPL Financial’s chief technical strategist Adam Turnquist, CMT.
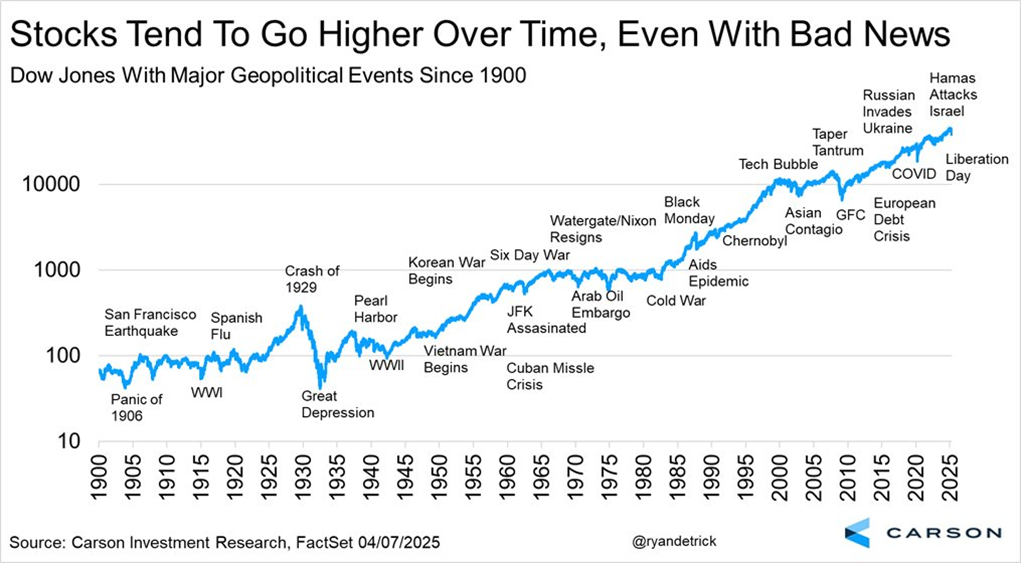
Stocks Have Risen Despite Bad News
I want to finish with a chart that Cynthia McLaughlin shared at our market volatility webinar last week. It serves as a reminder that we’ve been through periods of politically caused uncertainty (e.g., the Watergate scandal), wars (e.g., World War II) and other big events. Despite all of this, the stock market has risen over the long term.
Mr. Market rewards those who stay disciplined and do not give in to their fears.

-
Bond Strategies for a Shifting Interest Rate Environment
Bonds can help you achieve your financial goals by providing reliable cash flow, protecting your principal and creating growth through compounding interest. -
The S&P 500 Outcasts: Picking Up the Dropped Stocks
As a starting point for investors, this First Cut lists stocks possibly neglected due to their removal from the S&P 500 index. -
Building Bond Ladders With Mutual Funds and ETFs
The April 2025 AAII Journal shows how quasi-bond ladders can be created with mutual funds or ETFs instead of individual bonds by choosing funds with differing durations.
AAII Sentiment Survey
Neutral sentiment among individual investors about the short-term outlook for stocks increased in the latest AAII Sentiment Survey. Meanwhile, optimism and pessimism decreased.
Bullish sentiment, expectations that stock prices will rise over the next six months, decreased 3.5 percentage points to 21.9%. Bullish sentiment is unusually low and is below its historical average of 37.5% for the 15th time in 17 weeks.
Neutral sentiment, expectations that stock prices will stay essentially unchanged over the next six months, increased 4.8 percentage points to 22.5%. Neutral sentiment is unusually low and is below its historical average of 31.5% for the 40th time in 42 weeks.
Bearish sentiment, expectations that stock prices will fall over the next six months, decreased 1.3 percentage points to 55.6%. Bearish sentiment is unusually high and is above its historical average of 31.0% for the 21st time in 23 weeks. Bearish sentiment has now been above 50% for nine consecutive weeks, the longest period over 50% in the survey’s history.
The bull-bear spread (bullish minus bearish sentiment) decreased 2.2 percentage points to –33.6%. The bull-bear spread is below its historical average of 6.5% for the 16th time in 18 weeks and is below –20.0% for the ninth consecutive week. This is the longest streak below –20.0% since a 12-week stretch between September 14 and November 30, 1990.
This week’s special question asked AAII members how their sentiment toward the stock market has changed since the start of the year.
Here is how they responded:
- I’ve become more bearish: 54.6%
- I’ve become more cautious, but not bearish: 26.7%
- I’ve become more bullish: 8.6%
- It is about the same: 8.6%
- Not sure: 1.6%
Bullish: 21.9%, down 3.5 points
Neutral: 22.5%, up 4.8 points
Bearish: 55.6%, down 1.3 points
Bullish: 37.5%
Neutral: 31.5%
Bearish: 31.0%
See more Sentiment Survey results.

April 17, 2025 All-Time High Trend Strategies Are Not Without Costs and Risks
April 10, 2025 Winning and Losing Stocks During the Current Downturn
April 3, 2025 Staying Invested When Tariffs Rattle the Market
March 27, 2025 Gold Is Glittering but May Not Be Right for Your Portfolio

Discussion
Barry C from TX posted over 1 year ago:
Charles, you did it. This COI scared the bejeebers out of me by summoning up a psychological monster parade that only left our Beetlejuice as the band leader. It’s OK. We can say that name once or twice but NEVER three times. (1) In the Nov 1974 “Rumble in the Jungle” Ali pummeled Foreman nearly as much as Mr. Market has us 50 years later. (2) Monstrously ambitious Eve Harrington (Anne Baxter) destroyed Margo Channing (Bette Davis) career and marriage in “All About Eve” 1950. Margo (Bette) ominously predicted, “Fasten your seat belts. It’s going to be a bumpy night.” That summarizes the leitmotif of this COI in 11 words. [Film/Latin Buffs Note: “All About Eve” used a “in medias res” (“in the middle of things”) plot device. The first scene foretells the entire future just like this COI sets our expectations for how 2025 will end. You. Charles, you are an auteur. (3) The usual sources of boring data have turned scary. (3.1) Fed credit spread data and multiple consumer sentiment data (some from us) warn that BOTH business cash flows will drive up borrowing costs thus reducing business future earnings fanned by the “elephantine” monster in the room --- on-off tariff negotiations that are more “top secret” than Pentagon war plans. Tariffs appear to be “negotiated” by drawing ping-pong balls out of an urn ... or using Chinese numbers ending in “4” that portend “bad fortune” ... or by the score from the last round of golf. (3.1) Consumer sentiment polls ALL agree – inflation will rise by year end. This un-Casper like invisible monster will reduce everyone’s lifestyles by 3.0% to 3.5% as long as it hovers above us. You need to be old enough to remember the impact on your lifestyle 1970’s inflation made -- salary freezes, gasoline prices, 15% inflation, Paul Volker's Fed, 18% mortgage rates, etc. -- to know how far “the fog of a tariff war” can go. One blessing is Santa may not have Chinese-made toys for anyone.
Barry C from TX posted over 1 year ago:
Take a closer look at the last two charts: (A) LPL’s “death cross” chart and (B) Carson’s “Stocks Tend to Go Higher Over Time Even with Bad News” chart. #1 The first chart provides data on the historical probabilities for historical market trends following a market “correction” (down 20%) which is similar to the current drawdown. It displays SPX data back to 1957 when SPX was launched. These data show that the base rate probability is 72% SPX has RECOVERED from 6.3% to 10.5% in ONE YEAR or more in the past 67 years. #2 Great … except for the inconvenient fact that the current “correction” was DOWN 19.4% (or about TWICE) the HIGHEST expected recovery amount in history. It would take a 25% CORRECTION to get a down 20% SPX back to breakeven. #3 These data tell us that we can expect to get about 50% of our money back if the data is a reliable indicator. #4 The Carson chart shows a logarithmic scale progression of the DJIA index from 1900 to 1924 or for 124 years. #5 Remember the DJIA index only includes the Top 30 US companies by market cap. Some people expect large caps to lead markets down near term due to high (“inflated”) valuations and lower future earnings projections for the reasons given in this article. #6 DJIA is not as representative of the entire US market as a chart of SPX performance would be because SPX includes the Top 500 US companies. SPX is a broader sample but there are over 7,500 stocks listed on US exchanges. #7 But there are other more important trends in this chart that we can learn from. #8 Lay a ruler horizontally across the trend line from 1930 to 1955 and from 2000 to 2015. These dates visually approximate the timeframe it took for SPX to “recover” its prior performance levels after SPX experienced its two largest “drawdowns.” #9 The Great Depression of 1929 took until about 1954 – or about 25 YEARS – for “buy and hold” investors to “recover” their investment performance level before the 1929-1936 depression. #10 The lesson here is that some recoveries take longer than expected because of unforeseeable “downstream” factors, like a world-wide depression (1929-1936), local wars in Europe, Africa, and Asia, (1933-1940), and a 6-year World War (1941-1945). #11 The ”1-2 combo gut punches” of the 2000-2002 dot.com bubble and the 2007- 2009 Great Recession took until about 2015 -- 15 years -- to “recover” its prior performance levels before 2000. #12 The 2025 drawdown is much lower so far, but, as the data in this COI and past COIs have shown, the fat lady hasn’t sung yet. This opera has more acts before its over. Other sopranos will sing sad arias. #13 The message here is that market "recoveries" take MORE time than we expect. #14 I am a buy and hold investor. My portfolio has recovered about 50% of my paper losses during the 2025 YTD. The market can take this all back and more in an extended bear market .. or a recession. #15 I have seen several large banks and investment firms forecast that they expect a 25% recovery in 2026. #16 Results for the DT2 agenda should be known by then ... OR ... the 2026 mid-term election is going to be interesting.
vic smyth from illinois posted over 1 year ago:
There was an article that I believe was on AAII some time in the past 5-10 years that showed an economist's research of comparing the US stock market to the bond market. I was surprised at how many 10-year periods there were when the bond market outperformed the stock market, most recently from 2000-2012 and also from 1969 to 2009 (40 years). No one can predict where the markets will be, but with the S&P 500 grossly outperforming long term Treasury bonds over the past 10 years (12.5% vs -0.60%) one has to wonder if this will not revert back to the norm making it a good time to add long term bonds to a portfolio.
You need to log in as a registered AAII user before commenting.
Create an account