

All-Time High Trend Strategies Are Not Without Costs and Risks
by Charles Rotblut | April 17, 2025
Special note: The U.S. financial markets and the AAII office will be closed tomorrow in observance of Good Friday. On behalf of everyone at AAII, I wish a happy Easter and a happy Passover to those who are observing the respective holidays.
Even during corrections and bear markets, there are stocks that are trading at new high prices. Trend-following approaches seek to identify and invest in such stocks. A recently updated study found that buying stocks when they set a new record high price remains a profitable strategy, though transaction costs are a significant consideration.
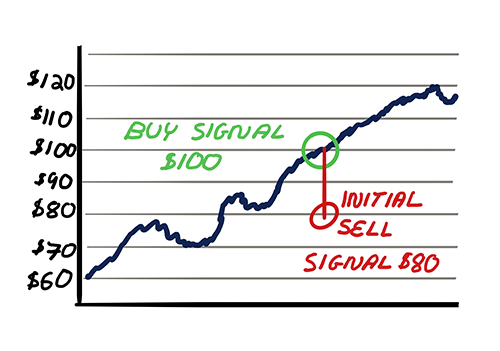 While often grouped under the momentum umbrella, trend-following looks at a stock’s own price history—focusing on whether it’s setting new highs—rather than comparing it to other stocks.
There are various measures for identifying trends, including measuring returns over a certain period, moving averages, price channels and indicators that combine price and volatility like Bollinger Bands. In this study, the researchers used a breakout above a stock’s all-time high price as their trend signal.
“[An all-time high break method] offers several advantages: first, it removes ambiguity—a stock reaching an all-time high is, by any standard, in an uptrend,” explain the authors. “Second, this extreme filter enhances selectivity, reducing portfolio holdings to a manageable number of stocks.”
The buy signal is generated when a stock’s closing price equals or exceeds its highest adjusted close, with splits and dividends accounted for. When an all-time high breakout occurs, the strategy indicates a purchase at the next day’s opening price.
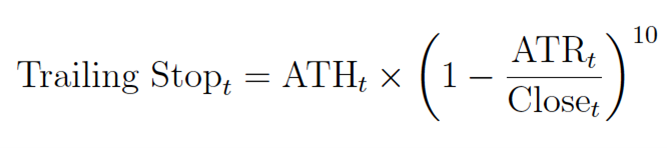
Trend strategies sell stocks when the price moves in a manner that breaks the trend. A simple example would be a break below a moving average. The study’s authors used the average true range (ATR), which is a volatility-based measure. Their ATR calculates “the average range between the highest and lowest prices over [the past 42] trading sessions.” One ATR is “the maximum distance a stock’s price is expected to travel from one day’s closure to the close of the next business day.”
Here is the formula. The “t” is the price at the close of a given trading day. The power of 10 is used to calculate 10 ATRs, which is the sell signal. The authors chose this to “accommodate the natural volatility of the asset and prevent premature exits.” They found that this approach “prioritizes capturing longer-term trends rather than exiting positions during short-term pullbacks.”
Approximately 66,000 trades on U.S. stocks were analyzed over a 75-year period. Returns were measured using risk units. One risk unit represents the expected dollar loss from the purchase price based on the sell signal (stop loss) of the day of the purchase. A $2 stop on a stock purchased at $100 would represent one risk unit. Risk units were used to account for the differing volatilities of each stock.
The average return per trade was 0.50 risk units. Many trades resulted in modest profits or losses. About 44% of trades were profitable. Losses exceeding the initial risk taken were realized on 8% of trades. More than offsetting this were the 22% of trades whose profits exceeded the risk taken. “Losses are controlled while the winners are allowed to grow, which is a core principle of trend-following systems,” observed the study’s authors.
In terms of tax exposure, the average duration of profitable trades exceeded one year (370 days). Such trades qualify for the more favorable long-term capital gains tax rate.
The results were calculated on a gross basis. Factoring in costs—particularly commissions—had a significant negative impact. Annualized returns plunged when incorporating Interactive Brokers’ $0.0035 per share commission with a minimum cost of $0.35 per transaction. The compound annualized return on a $100,000 portfolio dropped from a gross 15.02% to a net 2.45%. Even at portfolio sizes of $500,000, the strategy subtracted value relative to what would have been expected based on its market exposure (alpha).
Beyond transaction costs, a large potential drag is failing to stay disciplined. Trend-following strategies require acting on buy and sell signals when they occur. Not doing both will diminish returns. These strategies often seem simple to follow when demonstrated but can be very difficult to execute in real time. This is particularly the case during periods of heightened uncertainty and/or downside volatility like we are experiencing now.

-
Volatile Markets? How to Stay Calm and Invest Smarter in 2025
Watch our well-received webinar from this week, where AAII’s panelists gave perspective and tips on handling your investments during recent market events. -
The Trinity Portfolio: Combining Diversification, Tilts and Trend-Following
A strategy for combining global exposure, value and momentum, and both buy-and-hold and trend-following into a single portfolio. -
Key Metrics That Signal Strong Dividend Growth Potential
Focusing on companies with a history of dividend growth and the financial strength to sustain it increases your odds of realizing higher total returns.
AAII Sentiment Survey
Neutral sentiment among individual investors about the short-term outlook for stocks increased in the latest AAII Sentiment Survey. Meanwhile, optimism and pessimism decreased.
Bullish sentiment, expectations that stock prices will rise over the next six months, decreased 3.1 percentage points to 25.4%. Bullish sentiment is unusually low and is below its historical average of 37.5% for the 14th time in 16 weeks.
Neutral sentiment, expectations that stock prices will stay essentially unchanged over the next six months, increased 5.2 percentage points to 17.7%. Neutral sentiment is unusually low and is below its historical average of 31.5% for the 39th time in 41 weeks.
Bearish sentiment, expectations that stock prices will fall over the next six months, decreased 2.1 percentage points to 56.9%. Bearish sentiment is unusually high and is above its historical average of 31.0% for the 20th time in 22 weeks. Bearish sentiment has now been above 50% for eight consecutive weeks, the longest period over 50% in the survey’s history.
The bull-bear spread (bullish minus bearish sentiment) decreased 1.0 percentage points to –31.4%. The bull-bear spread is below its historical average of 6.5% for the 15th time in 17 weeks.
This week’s special question asked AAII members what type of stocks they are favoring.
Here is how they responded:
- Dividend stocks: 35.5%
- Value stocks: 15.8%
- Growth stocks: 9.6%
- Small-cap stocks: 2.5%
- A mix of the above/other: 36.3%
Bullish: 25.4%, down 3.1 points
Neutral: 17.7%, up 5.2 points
Bearish: 56.9%, down 2.1 points
Bullish: 37.5%
Neutral: 31.5%
Bearish: 31.0%
See more Sentiment Survey results.

April 10, 2025 Winning and Losing Stocks During the Current Downturn
April 3, 2025 Staying Invested When Tariffs Rattle the Market
March 27, 2025 Gold Is Glittering but May Not Be Right for Your Portfolio
March 20, 2025 March Charts of Interest: A Buying Opportunity?

Discussion
Barry J from TX posted over 1 year ago:
So, Charles, I only audited this course because I needed a PE credit and you told us there would be no math on the final exam. #1 How is this example of (1) a “just right” Mama Bear (2) CONTRIVED calculation of (3) an INVENTED statistic – “risk units” -- (a calculation so contorted that it reminds me of the difficulty of “sticking” an Olga Korbut dismount) NOT THE POSTER CHILD for violating the #1 FINANCIAL INDUSTRY ALL TIME TABU -- “TRYING TO TIME THE MARKET”? #2 I noticed you did not provide links so we can track down the original research of these brainiacs and ask them now much of tier personal CASH they earned from “capturing” all the “risk units” they earned over the 75 years they tortured the BACKTESTING dataset. #3 They found only 66,000 “eligible” trades over the 75 years. I estimate that investors make 66,000 trades every millisecond (or a total of 23,000,000 msec) EACH trading day of 250 days each year of all those 75 years the market was open to find 66,000 needles in their 75-year haystack. By way of comparison, markets would have been open 18,750 days when those 66,000 “gold ATR nuggets” were found … AFTER THE FACT. Remember, this strategy requires you track each ATR of EVERY stock day-over-day to identify each ATR. Then what? YOU yell “Stop the market!” and call a broker and have them put in a buy/sell order (that’s the way markets worked for at least 50 of those 75 years) and the “roundtrip cost of EACH buy-sell transaction cost an investor about $20. #4 What? This was only an experiment. I am shocked! Alert Captain Renault. Consider the similarities in this dialogue from the movie Casablanca with this strategy: Renault: What in heaven's name brought you to Casablanca? Rick: My health. I came to Casablanca for the waters [ATRs]. Renault: The waters? What waters? We're in the desert [of unautomated markets before the internet was commercialized in 1995 and zero trading costs were offered in 2019]. Rick: I was misinformed. #5 Charles, I’ll give you a pass on this one. I will pretend this article was 3-week late April Fool’s Day prank. #6 PS, Can I count this as my math credit?
Douglas R from Washington posted over 1 year ago:
The paper behind Mr. Rotblut’s article is “Does Trend Following Still Work on Stocks?” (2025) by Carlo Zarattini, Alberto Pagani, and Cole Wilcox, freely available at the link Mr. Rotblut kindly provides in his reviews. When reading finance research like this, I remind myself of the audience; most papers are written for other academic researchers or institutional investors, but not individual investors. Before accepting the findings, it is essential to me to evaluate whether the strategy is relevant and practical—or at least adaptable—for individuals. If not, the findings may be of little use to me. Having reviewed the paper through the lens of an individual investor, I have several comments on the article: Mr. Rotblut’s strongest critique is that “transaction costs are a significant consideration,” a point made in the title as well. I could agree, but this is unimportant because the strategy is not feasible for the vast majority of individual investors. The main obstacles are not the costs themselves, but the drivers of those costs. Implementing this strategy requires a fee-per-trade brokerage account with API access (such as IBRK), because automation is necessary. The strategy is beyond the capabilities of free Yahoo data and Excel; one would need a specialized proprietary platform or would have to write their own custom Python or R scripts. Furthermore, the high slippage stems from the extremely high trading frequency—about 880 trades per year over the backtest period. This level of activity makes automation a necessity, making it infeasible for the vast majority of individual investors. (The articles also fails to mention that the authors offer a “Turnover Control Mechanism” in the second half of their paper intended to reduce costs. I won’t describe it here either, since it is unimportant to individual investors when the strategy is not feasible.") Mr. Rotblut also highlights that the average holding period is 370 days, which would allow more trades to qualify for long-term capital gains tax treatment. However, this too is largely irrelevant for individual investors given the practical challenges of implementing the strategy. With an average of 880 trades per year, even if most qualified as long-term holdings, capital gains would be realized regularly, with almost none deferred. This high level of trading will result in frequent realization of gains, creating a tax drag that erodes the compounding benefits of pre-tax returns that might otherwise be possible with another selection strategy. Lastly, when he says, “While often grouped under the momentum umbrella, trend-following looks at a stock’s own price history,” it seems Mr. Rotblut insinuates that trend following is not properly categorized as a momentum strategy. Of course, the paper’s use of the breakout high method is not an example of cross-sectional momentum (relative momentum) that dominated the literature from the mid-1990s, but it is certainly an example of time series momentum (absolute momentum) that dominated the literature before this period and is mixed and mingled in the literature thereafter. I assert that momentum is where you find it, and this paper demonstrates that new price highs lead to even more highs from which one can profit. This point is missing from Rotblut’s article, and I think it is the single most valuable finding for individual investors. Momentum can be a powerful source of excess returns, and this paper illustrates an example—albeit one that is not feasible to implement—but nonetheless provides more evidence that momentum returns can be found in many ways. So, we individual investors should be encouraged to look for momentum strategies that are feasible to implement; there are many possibilities and we will find many that do not suffer from cost concerns or tax drags anymore so than other strategies.
You need to log in as a registered AAII user before commenting.
Create an account