

March Charts of Interest: A Buying Opportunity?
by Charles Rotblut | March 20, 2025
The S&P 500 index took less than one month to fall into its current correction. Historically, corrections have taken three to four months, on average, to bottom. Yesterday, CFRA Research chief investment strategist Sam Stovall tweeted that fast drops have historically been followed by fast rebounds. Tariffs are the big question mark, though.
This month’s charts of interest provide some insights you are likely not seeing in the headlines about the current market environment.
Buying on the Dips Frequently Pays Off
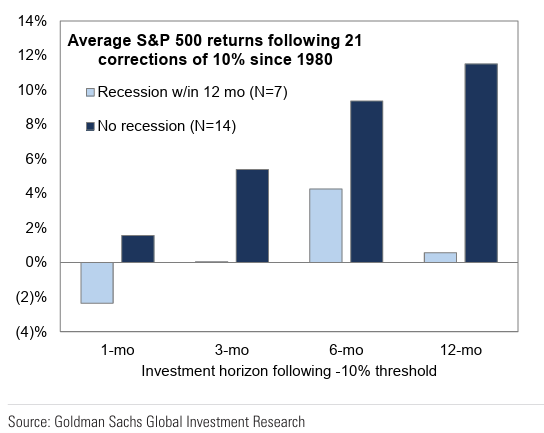
Buying stocks after the S&P 500 has fallen at least 10% has historically been a profitable move. “An investor buying the S&P 500 after it declined by 10% from its high would have enjoyed a positive return during the subsequent six months in 76% of 21 episodes, with the hit rate rising to 86% excluding the seven episodes that occurred within 12 months of a recession,” wrote Goldman Sachs strategists in a recent report.
The S&P 500 fell into a correction, defined by a drop of at least 10%, last week.
Not-too-Hot Inflation Is Good for Stocks
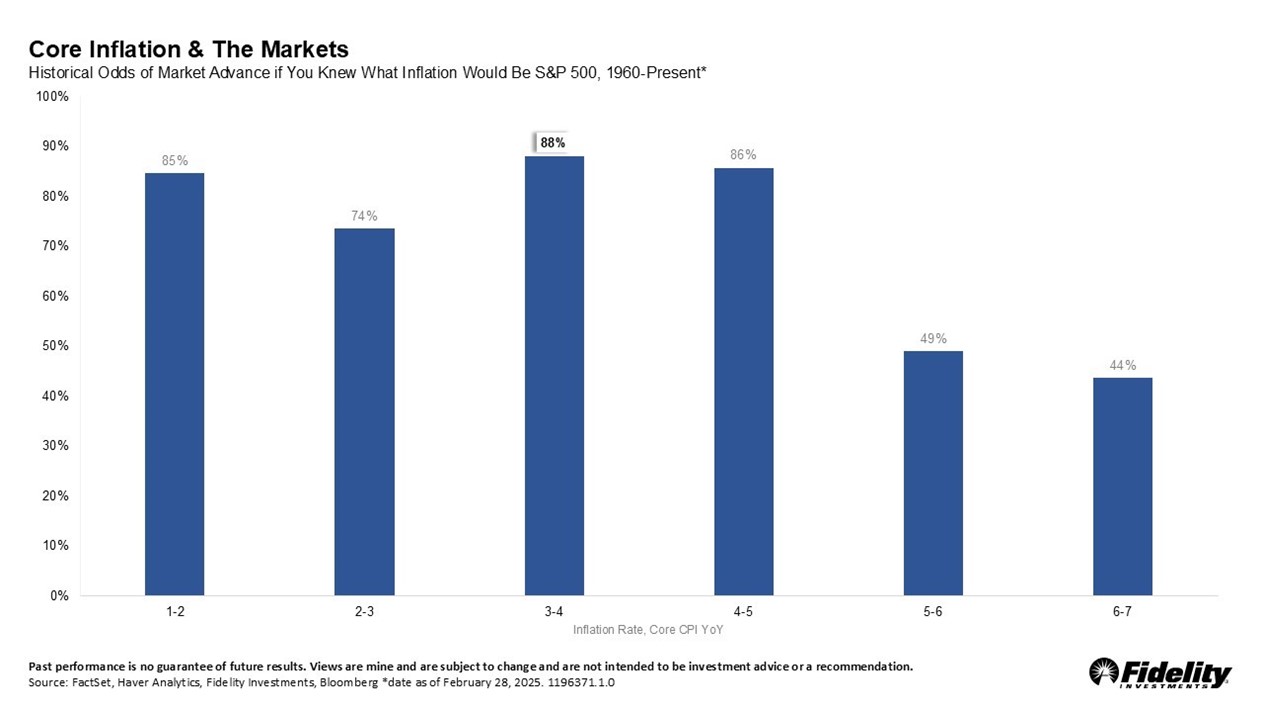
Inflation continues to be on many people’s minds, but the sticky moderate levels of it have not been kryptonite to stocks. According to Fidelity’s Denise Chisholm in a LinkedIn post, the best market returns have historically occurred when the core consumer price index (CPI) is between 3% and 4%—”exactly where we are today.”
Fewer Calls for an Economic Soft Landing
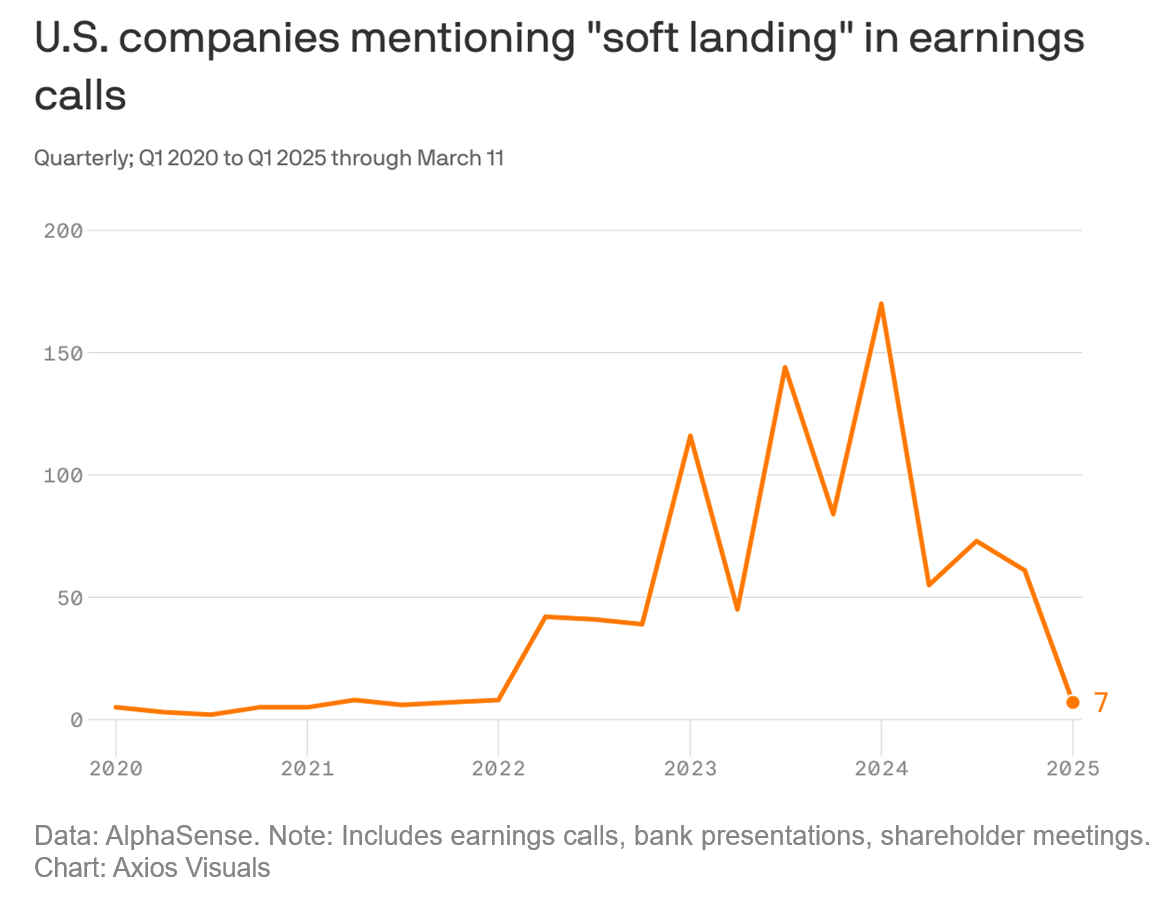
The number of corporate executives who talk about the possibility of an economic soft landing—low inflation occurring without a recession—has significantly dropped. “On the bright side, AlphaSense notes there’s been no uptick in mentions of ‘recession’ yet,” observed Axios.
Expectations for Several Interest Rates Cuts Are Softening
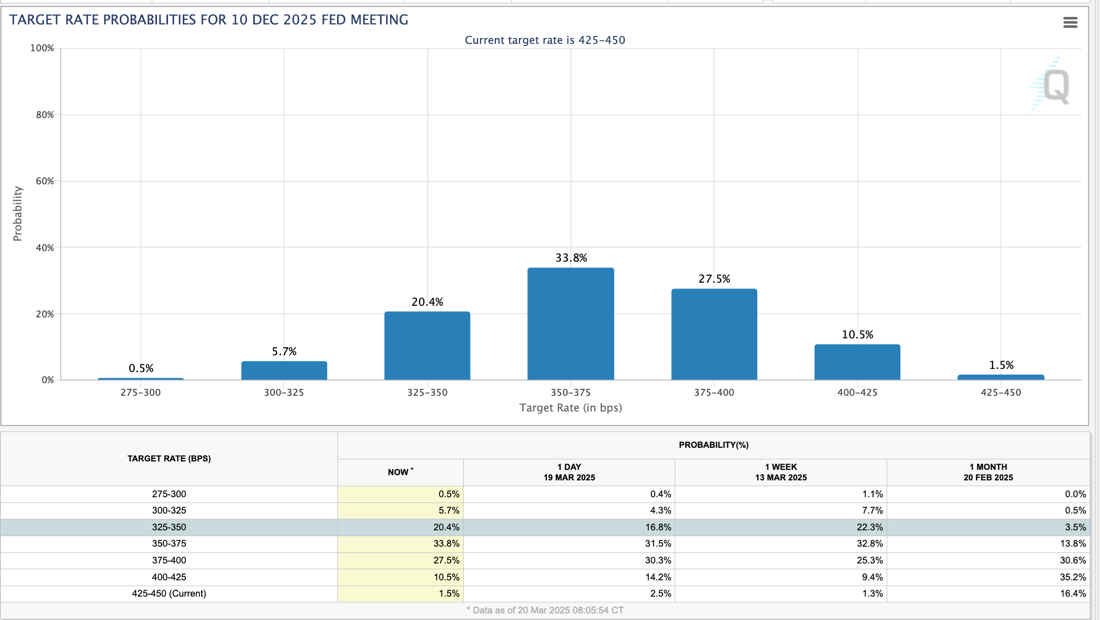
Yesterday’s updated projections by the Federal Open Market Committee (FOMC) reinforced the outlook for just one to two quarter-point (0.25%) interest rate cuts this year. Federal fund future traders think there could be more.
As of this morning, expectations for interest rates to be cut by up to one full percentage point in 2025 have rebounded. The CME FedWatch Tool shows a 20.4% chance of this occurring by the December 2025 meeting, up notably from yesterday. Just one month ago, traders were pricing in a 3.5% chance of this happening.
Source: CME Group.
Trading in 401(k) Plans Increased Last Month
“Trading activity was above-normal on nearly half of the days [in February],” observed 401(K) recordkeeper Alight Solutions. The trading involved “money almost exclusively moving from equity funds to fixed income instruments.” Target-date funds saw the largest outflows even though they are designed to provide age-appropriate allocations.
I’ll add that Alight Solutions’ data shows total transfers as a percentage of starting balance as being just 0.27%. It is possible that those who traded the least were also the ones with the largest balances in their 401(k) accounts.
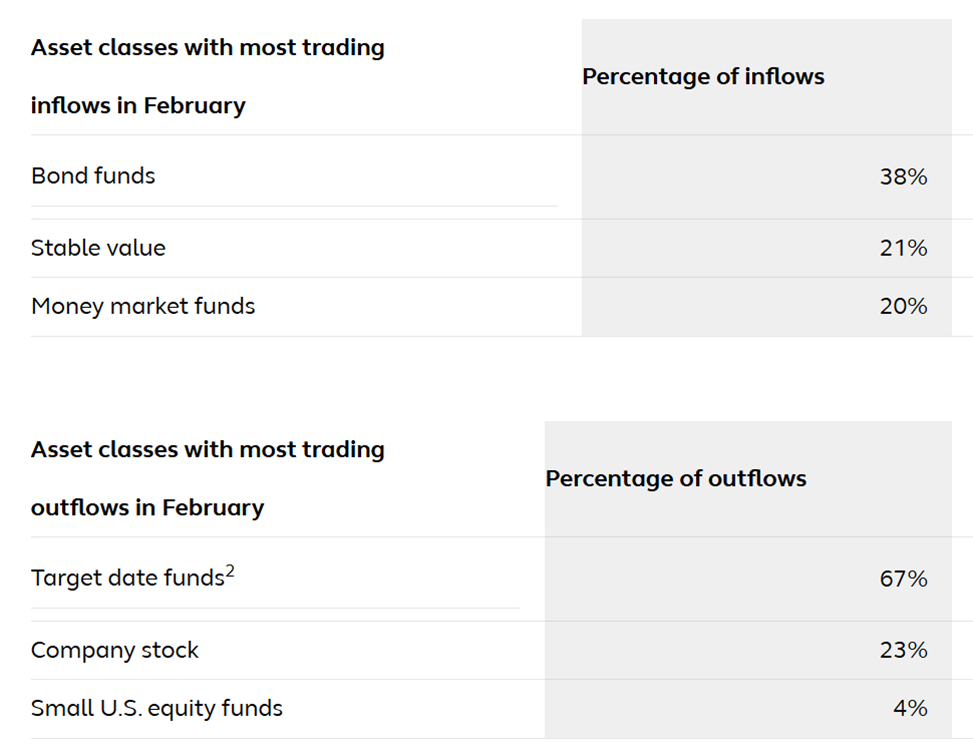
Source: Alight Solutions.
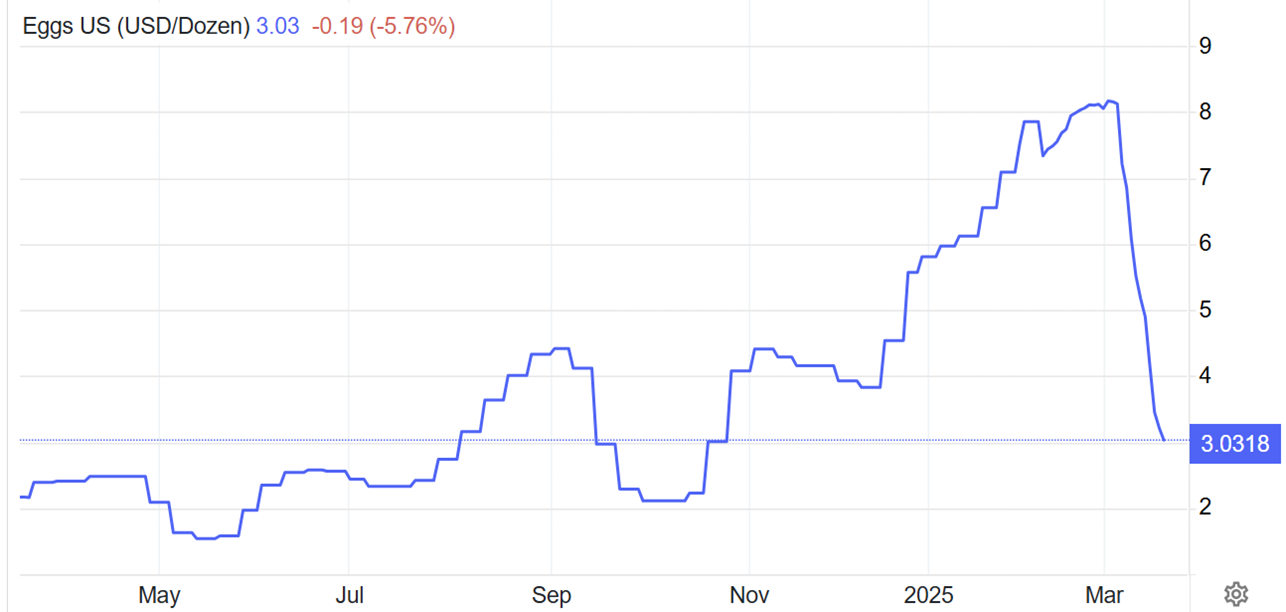
You Can Go Back to Enjoying Your Omelets
I posted a chart last month showing how much egg prices have risen. The surge has now been cracked as this chart from Trading Economics shows. “No significant outbreaks of highly pathogenic avian influenza (HPAI) have been reported in March to date and the supply situation is rapidly improving,” reported the U.S. Department of Agriculture in its weekly Egg Markets Overview.

-
Stock Market Retreats and Recoveries
Only six months, on average, have separated the end of one decline and the start of the next one, but recoveries have been quick. -
It's Been Difficult for the Fed to Pull Off Economic Soft Landings
Most prior rate-hike cycles have been followed by recessions, so-called hard landings. Only one of the 11 previous rate-tightening cycles has resulted in a perfect soft landing. -
How Dividend-Paying Mutual Funds and ETFs Differ
Yield-producing funds provide a steady income source, making them attractive for retirees and income-focused investors. Compare equity income funds in the March 2025 AAII Journal.
AAII Sentiment Survey
Optimism among individual investors about the short-term outlook for stocks increased in the latest AAII Sentiment Survey. Meanwhile, neutral sentiment and pessimism decreased.
Bullish sentiment, expectations that stock prices will rise over the next six months, increased 2.5 percentage points to 21.6%. Bullish sentiment is unusually low and is below its historical average of 37.5% for the 10th time in 12 weeks.
Neutral sentiment, expectations that stock prices will stay essentially unchanged over the next six months, decreased 1.4 percentage points to 20.3%. Neutral sentiment is unusually low and is below its historical average of 31.5% for the 35th time in 37 weeks.
Bearish sentiment, expectations that stock prices will fall over the next six months, decreased 1.1 percentage points to 58.1%. Bearish sentiment is unusually high and is above its historical average of 31.0% for the 16th time in 18 weeks. This is the first time in the history of the survey that bearish sentiment has exceeded 57% for four consecutive weeks.
The bull-bear spread (bullish minus bearish sentiment) increased 3.6 percentage points to –36.5%. The bull-bear spread is below its historical average of 6.5% for the 11th time in 13 weeks.
This week’s special question asked AAII members where they put the odds of a recession occurring before the end of the year.
Here is how they responded:
- A higher-than-typical chance: 50.4%
- Highly likely: 21.7%
- Not more or less likely than I would normally expect: 18.0%
- Unlikely: 9.7%
- Not sure: 0.3%
Bullish: 21.6%, up 2.5 points
Neutral: 20.3%, down 1.4 points
Bearish: 58.1%, down 1.1 points
Bullish: 37.5%
Neutral: 31.5%
Bearish: 31.0%
See more Sentiment Survey results.

March 13, 2025 Investing for the Long Term Despite Tariff-Driven Volatility
March 6, 2025 33 Top-Graded Mid-Cap Dividend Payers
February 27, 2025 Buffett's Cash Problem Isn't Your Problem
February 20, 2025 February Charts of Interest: Tariffs, Uncertainty, Eggs and More

Discussion
Barry J from TX posted over 1 year ago:
Charles, first, shoutout to you. #1 You wrote, “COI provides insights you are likely not seeing in the headlines about the current market environment,” This is not an empty boast; it’s a fact. Your curation of the COI series provides a valuable market “x-ray” that supplements and interrelates relevant market themes that other analyses I follow @ SCHW, FID, VGD, MORN, and WSJ also analyze. You add experienced insight that some other sources may not and you provide an II perspective.. Thanks for educating us. #2 The overring theme here is “Buying on the dip.” That requires geld, chutzpah, and mazel. #3 When a group of economists agrees on anything, never, never, never forget [channeling Churchill] that almost all Fed FOMC members are economists. The primary tools an economist brings to any party are (1) personalized “assumptions” that define how THEIR favorite economic models work and (2) “marginal analysis.” They minimize data averages and market trends and focus on what the NEXT data point “at the margin” (the next unit) AND they make ASSYMPYIONS based on THEIR economic MODELS. That’s why FOMC has 11 members and not 1. ALL disagree frequently based on where they were schooled, the “marginal” data of their “preferred indicators” they follow, and whose version of “marginal analysis” was inculcated into them with a “loaded" PhD held to their heads. [Insert your favorite economist jokes here. Limit 3 per customer. Mine are (1) “If it were a real $100 bill …”; (2) “Assume we have a can opener …”; (3) Any joke that starts with “How many economists does it take to …?”] #4 In this month’s COI snippet “Not-too-Hot Inflation Is Good for Stocks, “ Fidelity’s Denise Chisolm mashes up recent UMI and AAII SURVEY data with MARKET DATA and concludes that AAII Sentiment survey data does not have a good track record for forecasting the future ... at least maybe this time. Maybe we are putting our money where our “emotions” are; once again proving that WHEN “investing” decisions are dominated by “fear or flight” responses and confabulated by biased conclusions System 1 BEFORE System 2 can get you to a balanced "rational" perspective .... "whatever stories System 1 presents to you becomes "what you "see" is all there is to see.” [Kahneman (2011] #5 Denise's data aligns with your data on market recovery times after corrections. #6 In “What We’ve Learned From 150 Years of Market Crashes,” (03/17/25) Morningstar’s Paul Kaplan concluded that “It’s impossible to predict how long a stock market recovery will take. If you don’t panic and don’t sell your stock holdings when the market crashes, you will be rewarded LT.” #7 Good advice is out there. We just need to listen to it.
You need to log in as a registered AAII user before commenting.
Create an account