

Investing for the Long Term Despite Tariff-Driven Volatility
by Charles Rotblut | March 13, 2025
The S&P 500 index entered a correction today. The large-cap index closed down more than 10% from its last record high.
The latest round of stock market volatility is being caused in large part by the uncertainty regarding tariffs. It is becoming increasingly difficult to determine what tariffs have been raised, levied and/or pulled back. This uncertainty makes it difficult for businesses to plan and budget. It also makes it difficult for economists to make projections about the economy.
We are seeing the uncertainty show up in various measures.
- The AAII Sentiment Survey has recorded among the lowest bullish sentiment and highest bearish sentiment readings in its history. (Historically, the S&P 500 has often realized above-average six-month returns following such readings.)
- The Federal Reserve Bank of Atlanta’s GDPNow model says the U.S. economy is contracting 2.4% this quarter. This is a complete reversal from the 2.3% growth projected in late February.
- Expectations for the Federal Reserve to cumulatively cut interest rates by a full percentage point this year have jumped from 2% one month ago to 19% now.
All this could change. Under normal circumstances, crystal balls are cracked. Now, they are broken into pieces.
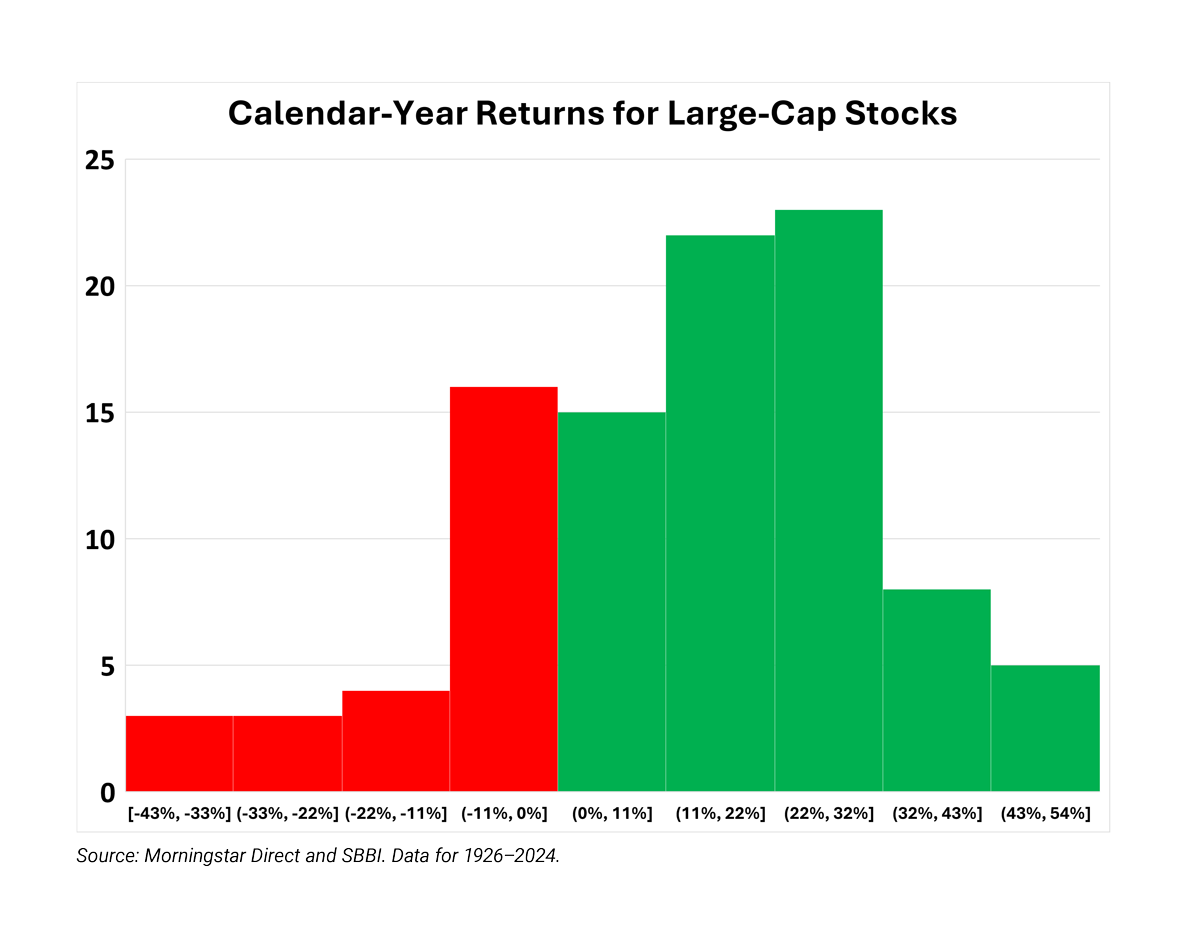
Still, history provides some guidance for us individual investors.
- Calendar-year returns are rarely average. You can see this in the above histogram of calendar-year returns for large-company stocks. There have only been three calendar years where the annual gains for long-term stocks were very close to the 99-year average return of 12.3%: 1959, 1965 and 2016.
- It’s not unusual to see stocks drop. The S&P 500 has averaged a 15% drop at some point during each calendar year over the past 30 years, according to Ritholtz Wealth Management’s Callie Cox. CFRA Research’s Sam Stovall counts 24 corrections as having occurred since the end of World War II—about once every three years. Pullbacks—declines of 5% to 9%—are far more common.
- Looking for bargains when the markets are down can be profitable. Stovall’s data also shows that investors can look like great market timers if they buy stocks when the S&P 500 falls by a seven-percentage-point interval (down 7%, 14%, etc.). If you are worried about further downside, follow the footsteps of Sir John Templeton and place a limit order to buy specific stocks at a significant discount to their intrinsic value (based on discounted cash flow or valuation multiples).
- Timing the market does not work. While opportunities to buy stocks at discounted prices do appear, changing your allocation based on what you think might happen is not a good strategy. Investors who stick to disciplined strategies and are unfazed by market volatility achieve the highest long-term returns. If you feel an overwhelming urge to act, do so at the margins or with dollars you’ve previously and purposely set aside to speculate with.
- Down markets provide opportunities for tax savings. I will say this until I am blue in the face: Do your Roth conversions when the stock market is down. The Internal Revenue Service (IRS) only cares about the dollar amount converted from a traditional IRA, a 401(k) or similar type of tax-deferred account to a Roth account, not the number of shares converted. So, when prices are down—as they are now—you can move more shares over to a Roth account for the same tax impact.
- Finally, heed the advice given in “The Hitchhiker’s Guide to the Galaxy”: Don’t panic.

-
Strategies to Counteract Market Madness
Recorded at the start of the pandemic, this nine-minute video gives concrete tips for staying calm in the face of market adversity and sticking to your long-term investing plan. -
The Rules Regarding Retirement Account Rollovers
Terms and tips to help you decide whether to transfer retirement savings from one account to another. -
Which Protects Your Retirement Better: Rebalancing or Buffer Strategies?
The March 2025 AAII Journal shows how market downturns can impact investors withdrawing assets and compares two approaches to handling withdrawals in your retirement portfolio.
AAII Sentiment Survey
Pessimism among individual investors about the short-term outlook for stocks increased in the latest AAII Sentiment Survey. Meanwhile, optimism and neutral sentiment decreased.
Bullish sentiment, expectations that stock prices will rise over the next six months, decreased 0.2 percentage points to 19.1%. Bullish sentiment is unusually low and is below its historical average of 37.5% for the ninth time in 11 weeks. Bullish sentiment was last lower on September 22, 2022 (17.7%). This is the first time that bullish sentiment has been below 20% for three straight weeks.
Neutral sentiment, expectations that stock prices will stay essentially unchanged over the next six months, decreased 1.9 percentage points to 21.7%. Neutral sentiment is unusually low and is below its historical average of 31.5% for the 34th time in 36 weeks.
Bearish sentiment, expectations that stock prices will fall over the next six months, increased 2.1 percentage points to 59.2%. Bearish sentiment is unusually high and is above its historical average of 31.0% for the 15th time in 17 weeks. This is the first time in the history of the survey that bearish sentiment has exceeded 57% for three consecutive weeks.
The bull-bear spread (bullish minus bearish sentiment) decreased 2.3 percentage points to –40.1%. The bull-bear spread is below its historical average of 6.5% for the 10th time in 12 weeks.
This week’s special question asked AAII members if they think other investors are too bullish or bearish right now.
Here is how they responded:
- They are too bearish: 31.9%
- Their sentiment toward the market is about right: 34.7%
- They are too bullish: 23.9%
- No opinion/not sure: 9.0%
Bullish: 19.1%, down 0.2 points
Neutral: 21.7%, down 1.9 points
Bearish: 59.2%, up 2.1 points
Bullish: 37.5%
Neutral: 31.5%
Bearish: 31.0%
See more Sentiment Survey results.

March 6, 2025 33 Top-Graded Mid-Cap Dividend Payers
February 27, 2025 Buffett's Cash Problem Isn't Your Problem
February 20, 2025 February Charts of Interest: Tariffs, Uncertainty, Eggs and More
February 13, 2025 Five Simple Steps to Make Sense of Earnings Reports

Discussion
Rob from NC posted over 1 year ago:
EXCELLENT advice! Stay the course!!
Barry J from TX posted over 1 year ago:
Charles, -- or should we call you Deep Thought henceforth -- you provided “The Ultimate Answer” to “The Ultimate Question” many AAIIers want to know now. #1 A little background might be needed before Charles orders new business cards. #2 In “Hitchhiker’s Guide to the Galaxy” from the 1970s the protagonist Arthur Dent, like today’s AAIIers, seeks “The Answer” to the "Ultimate Question of Life, the Universe, and Everything” to save the Earth from being destroyed. A supercomputer, Deep Thought, reports “The Answer” is “42.” That‘s it; that's "The Answer." Silly, but mysterious enough that for the last 50 years an army of “Hitchhiker’s Guide” followers have debated why “42” Is the “Ultimate Answer.” After having derived "The Answer," Deep Thought was instructed to determine what question “42” answers. Alas, after Deep Though completes the calculations, but before they could be communicated, The Earth is destroyed by Vogon invaders. #3 Charles’ analysis answers “The Ultimate Question” for AAIIers: what should we do when markets go into a “correction” (down >10%): “Don’t panic.” #4 Like Arthur Dent, Charles may have saved YOUR "world."
Barry J from TX posted over 1 year ago:
#1 Charles, thank you for your diligence in finding reputable data from reputable sources to put the recent downturn into a historic (versus a hysterical) perspective. #2 In a March 2024 WSJ interview, another astute man who focused on the emotional and psychological errors that produce an inability to make fact-based decisions, Dan Kahneman said, “The most important question to ask before making a decision is … ‘What is the base rate?’” … you should begin every major decision by figuring out the objective odds of success, given the historical range of outcomes in similar situations.” #3 If anyone is having trouble figuring out the significance of the histogram Sam Stovall provided on annual market returns, consider this. In the 98 years of data shown (1926-2024), the S&P 500 ENDED THE YEAR up 62% of the time vs down 26% of the time. That’s a base rate with odds of 2.4 to 1. The 60 years when markets were up greater than 15% years the base rate odds are 2.3 to 1. #4 Sam Stovall also reports 24 corrections since 1945; a base line of 1:3. #5 Odds are improving in more recent times to 3.3 to 1. Always factor in the odds based on the base rate. These data convert into favorable odds of 70% to 75% to "Don't panic." #6 Data in the WSJ this week showed S&P 500 down 7% from 02/18 and compared this to DT1’s first term first year (2016) where markets finishing up 18% by EOY. #7 Reliable base rate data is very important when investors views are also influenced by an elevated recency bias. #8 Market downturns are not all alike. In “Stock for the Long Run” Jeremy Siegal described in detail the events that precipitated market crashes of 1929, 1987, 2000, and 2008. Each had a theme, but all of them had different combinations of interacting forces causing the large drawdowns that occurred. #9 The main thing to take note of in the data from the AAII Sentiment Survey is the repeated use of word “unusually” to characterize ALL possible market perspective – UNUSUALLY bearish, UNUSUALLY neutral, and UNUSUALLY bullish. #10 I have seen my PF decline well over $100,000 in the last 3 weeks. #9 Given the base rate data, let’s run though the strategic choices I have. (1) Buy the dip? How much can 5% cash in my PF help? IF perfectly timed (good luck with that) and riding it up 25% by EOY 2025, I might “juice” my annual total return 1.25%. (2) Sell before the crash? Besides the enormous timing risks that I will miss the "magic price" -- base rate is very unfavorable -- the base rate is 100% I will pay taxes that will reduce any “profits” by another 15%-35%. #10 I thank the Lord that He / She blessed me with the ability to understand base rates, and to estimate probabilities, and be “blessed” with the “paper losses” I have and not the "real losses" I could have, and the Faith to “Don’t panic.”
Charles Rotblut from IL posted over 1 year ago:
Thanks Rob. Barry, you left out, "bring a towel." :)
Barry J from TX posted over 1 year ago:
Deep Thought Charles is right. Besides "Don't panic," "The Hitchhiker's Guide to the Universe" also recommends "... "and bring a towel." Arthur Dent listed 8 uses for a towel across the universe. A towel has similar multiple utilities in investing. If you think of "a towel" as a homophonic useful (tool-like) metaphor for "a tool" then a towel can assume many tool-like properties. Examples of AAII "towels" to hitchhike across the financial universe include (1) the PRISM process, (2) the AAII Community, (3) the 60 or so AAII Model Portfolios, (4) the 4 Premium offerings, (5) the Conferences, (6) AAII Regional Chapters, (7) Newsletters, etc.) or (8) anything else that helps you IMPROVISE / LEVERAGE / INCREASE your investing skill set when confronted by unusual and/or perilous situations in strange places like ... markets.
You need to log in as a registered AAII user before commenting.
Create an account