

33 Top-Graded Mid-Cap Dividend Payers
by Charles Rotblut | March 06, 2025
Featured Tickers: IYY
REGL
IYY
REGL
Dividends are commonly thought of as being synonymous with large-cap stocks. To a certain extent, this makes sense. Currently, more than 80% of S&P 500 index companies pay a dividend.
Investors who prefer dividends do a disservice to their portfolios when they focus solely on large-cap companies. While such companies tend to be more stable and past the stage where growth consumes cash flow, there are many smaller-sized dividend-paying stocks.
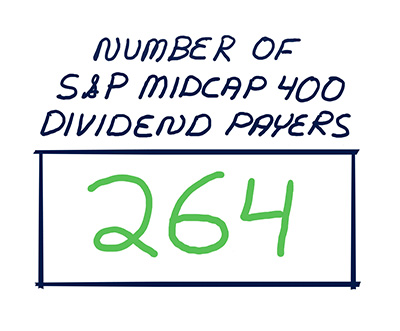
Nearly two-thirds (264) of the stocks in the S&P MidCap 400 index pay dividends. Their median yield is 2.1%. This is double the broader market’s yield, as measured by the iShares Dow Jones U.S. ETF  (IYY).
There is even an index that tracks a subset of such stocks: The S&P MidCap 400 Dividend Aristocrats index. Its components are mid-cap companies with at least 10 consecutive years of dividend increases. The index marked its 10th anniversary last week. The ProShares S&P MidCap 400 Dividend Aristocrats ETF (REGL) tracks it.
Not all dividend paying stocks are attractive stocks.
About 5% of S&P MidCap 400 dividend payers (23) have cut their dividend at least once in the past five years. Earnings payout ratios for 47 of these dividend payers equal or exceed 75%. (The earnings payout ratio measures the percentage of earnings that dividends account for.) Current yields are below the five-year average yield for 123 of the mid-cap dividend payers—a sign of pricey valuations. (Yields and valuations are inversely related. A low yield implies that a stock’s valuation is expensive.)
Thus, like any other group of stocks, care needs to be taken when looking at dividend payers.
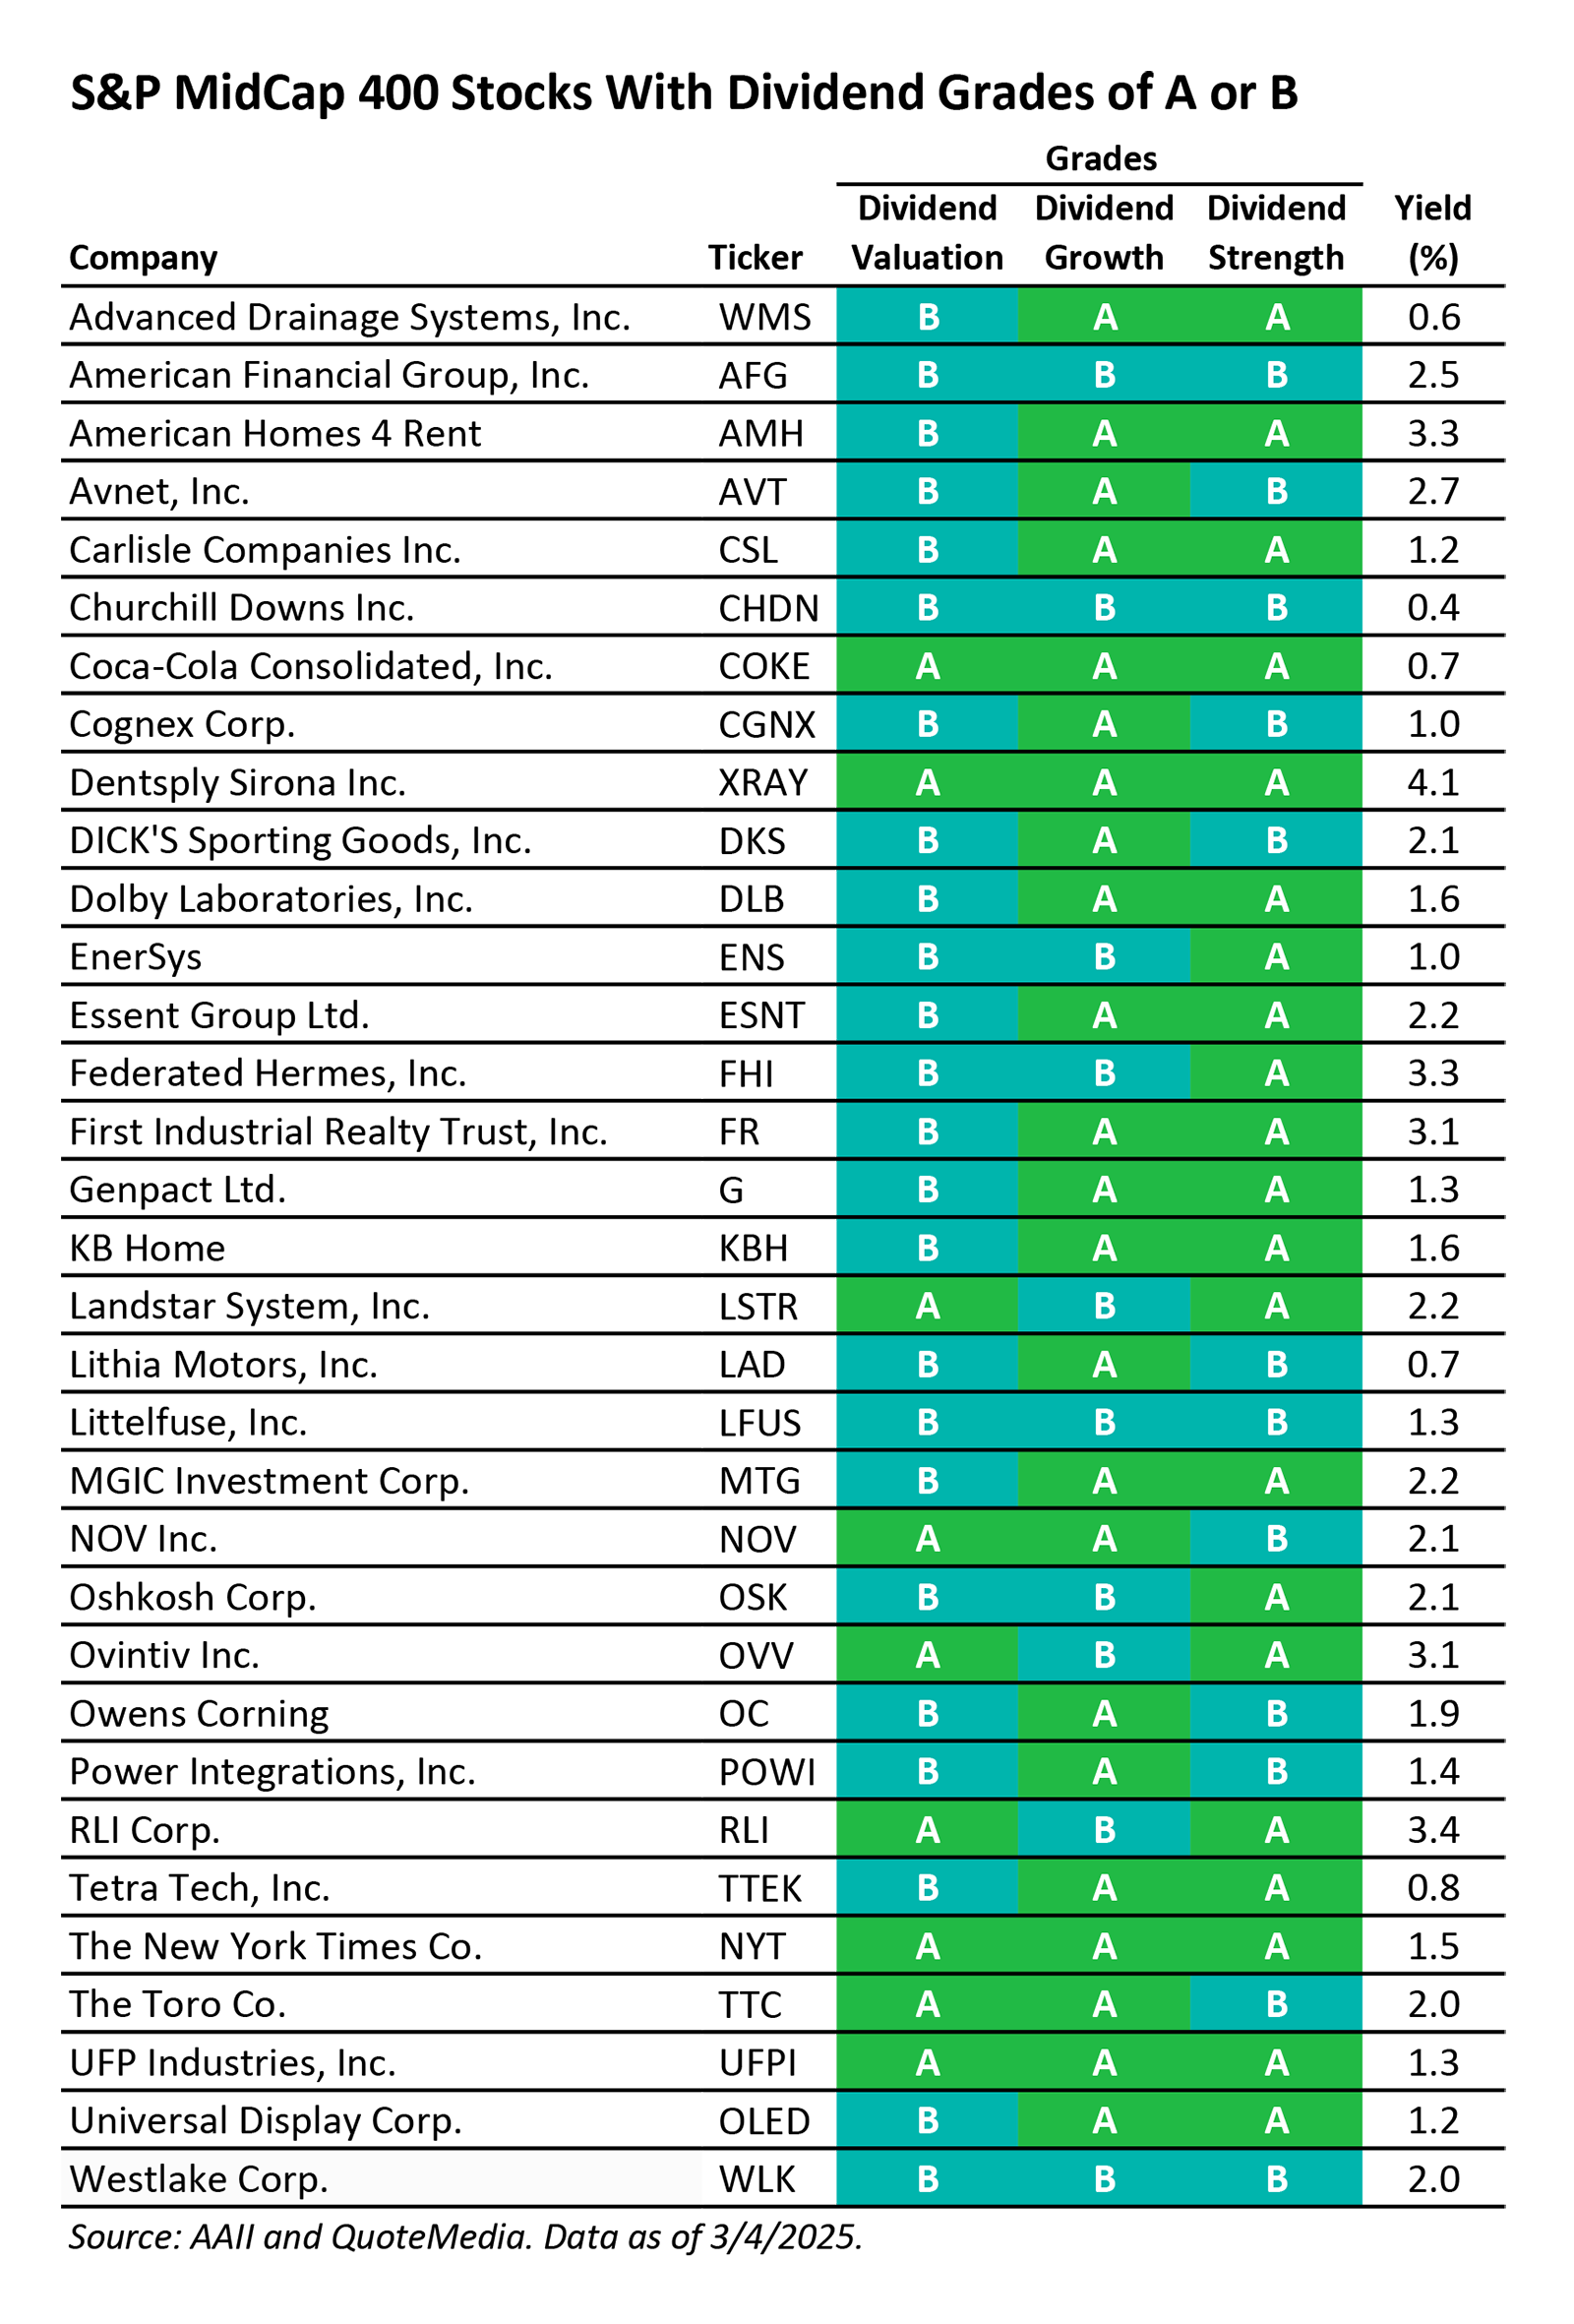
I ran the list of dividend-paying mid-cap stocks through our Dividend Screener. This screener, which is part of AAII Dividend Investing (DI), looks at dividend stocks from three viewpoints that we call pillars: dividend valuation, dividend growth and dividend strength. Of the mid-cap stocks screened, 33 had grades of A or B for all three dividend pillars.
The Dividend Valuation Grade compares a stock’s current dividend yield and shareholder yield (dividend yield plus buyback yield) to its historical yields. Yields above the historical average are better. The Dividend Growth Grade not only considers a company’s dividend growth but also growth in cash flow from operations. Rising cash flow funds dividend growth. Return on assets (ROA) is included as a profitability filter. The Dividend Strength Grade analyzes the earnings payout ratio, the relative debt level and the amount of interest expense relative to earnings. Poor numbers for these measures result in weak dividend pillar grades and can signal that the dividend is at risk of being cut. Stocks are also penalized if they have previously cut their dividend.

-
Three Pillars for Successful Dividend Investing
A look at a total-return strategy that seeks stocks that have the potential to rise in price and make larger dividend payments in the future. -
What Are Mid-Cap Stocks?
If you’re thinking about adding mid-cap stocks to your portfolio, it’s important to understand what they are, as well as the pros and cons of investing in these types of companies. -
A Fund Manager’s Rules for Selling Stocks
Read the March 2025 AAII Journal and find out how mastering the art of knowing when to sell can make a big positive difference in your long-term returns.
AAII Sentiment Survey
Neutral sentiment among individual investors about the short-term outlook for stocks increased in the latest AAII Sentiment Survey. Meanwhile, optimism and pessimism decreased.
Bullish sentiment, expectations that stock prices will rise over the next six months, decreased 0.1 percentage points to 19.3%. Bullish sentiment is unusually low and is below its historical average of 37.5% for the eighth time in 10 weeks. Bullish sentiment was last lower on March 16, 2023, (19.2%) and was among the lowest 66 readings in the survey’s history.
Neutral sentiment, expectations that stock prices will stay essentially unchanged over the next six months, increased 3.6 percentage points to 23.6%. Neutral sentiment is below its historical average of 31.5% for the 33rd time in 35 weeks.
Bearish sentiment, expectations that stock prices will fall over the next six months, decreased 3.5 percentage points to 57.1%. Bearish sentiment is unusually high and is above its historical average of 31.0% for the 14th time in 16 weeks.
The bull-bear spread (bullish minus bearish sentiment) increased 3.5 percentage points to –37.8%. The bull-bear spread is below its historical average of 6.5% for the ninth time in 11 weeks.
This week’s special question asked AAII members how, if at all, they changed their approach to investing recently.
Here is how they responded:
- I’ve become much more conservative/cautious: 28.9%
- I’ve become slightly more conservative: 26.9%
- I’ve switched around some investments, but only made modest changes overall: 19.4%
- I’ve become more aggressive: 4.9%
- No changes: 20.0%
Bullish: 19.3%, down 0.1 points
Neutral: 23.6%, up 3.6 points
Bearish: 57.1%, down 3.5 points
Bullish: 37.5%
Neutral: 31.5%
Bearish: 31.0%
See more Sentiment Survey results.

AAII Asset Allocation Survey
Individual investors’ allocations to stock decreased while bond and cash allocations increased in the February Asset Allocation Survey.
Stock and stock fund allocations decreased 1.2 percentage points to 67.9%. Stock and stock fund allocations are above their historical average of 61.5% for the 57th consecutive month.
Bond and bond fund allocations increased 0.2 percentage points to 14.6%. Bond and bond fund allocations are below their historical average of 16.0% for the 13th consecutive month.
Cash allocations increased 1.0 percentage point to 17.4%. Cash allocations are below their historical average of 22.5% for the 27th consecutive month.
- Stocks and Stock Funds: 67.9%, down 1.2 percentage points
- Bonds and Bond Funds: 14.6%, up 0.2 percentage points
- Cash: 17.4%, up 1.0 percentage points
- Stocks: 30.0%, down 0.4 percentage points
- Stocks Funds: 38.0%, down 0.8 percentage points
- Bonds: 4.4%, down 0.0 percentage points
- Bond Funds: 10.3%, up 0.2 percentage points
- Stocks/Stock Funds: 62.0%
- Bonds/Bond Funds: 16.0%
- Cash: 22.0%
Take the Asset Allocation Survey.
February 27, 2025 Buffett's Cash Problem Isn't Your Problem
February 20, 2025 February Charts of Interest: Tariffs, Uncertainty, Eggs and More
February 13, 2025 Five Simple Steps to Make Sense of Earnings Reports
February 6, 2025 How Tariffs Could Affect U.S. Individual Investors

Discussion
James from TX posted over 1 year ago:
International dividend stocks pay much higher dividends at this time. For example, the following stocks pay more than 20%: Petrobras -Brazil oil company, Torm- 30% oil tankers, Thungela resources - 10% coal mining South Africa. In addition, when the value of the American dollar crashes the dividends will increase. So say the American dollar drops by 50% in value: then the dividends paid by these companies will double. As we watch the US economy, do not forget that we are the most indebted country in world history. This will not end well as we will shortly see. Any investments in companies relying on the American consumer are destined for big trouble as the approaching inflation will cause discretionary income to vanish and the consumer will spend all of his cash on food and shelter.
Barry J from TX posted over 1 year ago:
Charles, Thanks for the ProShares S&P MidCap 400 DIV Aristocrats ETF (REGL) tip. I noticed that the choices for “good” dividend stocks narrowed as I parsed the data you provided. #1 264 S&P MidCap 400 index pay dividends with a median yield @ 2.1% [ 264/400 = 66% or 2 in 3]; 33/264 had A/B grades for all 3 dividend pillars [33/264 = 12.5% or 1 in 8]; yet I could only identify 4 of the 33 with all AAA grades [4/33 = 12.5% or 1 in 8]. So, the universe of “buys” reduced to 4 of 400 = 1% = 1 in 100. Those 4 pay AND other the 264 pay a median of 1.40%. So, it looks like the better choice would be to buy REGL and let the ETF fund managers do all the heavy lifting for the hefty 0.40 ER ($400 per $10,000) you pay them especially since REGL provides a 2.21% distribution versus the median dividend distribution at 1.40%.
You need to log in as a registered AAII user before commenting.
Create an account