

Five Simple Steps to Make Sense of Earnings Reports
by Charles Rotblut | February 13, 2025
We remain in the midst of fourth-quarter 2024 earnings season. LSEG Data & Analytics says that S&P 500 index companies, in aggregate, are beating analysts’ earnings expectations by 6.3%. This is close to being in line with the average earnings beat over the past four quarters—good, but not remarkable.
Those of you who own individual stocks have already been inundated with earnings reports. It can be a lot to go through. I follow a routine process for analyzing earnings news that I’ve found helpful. It identifies key information from earnings releases and other sources without requiring a significant amount of time.
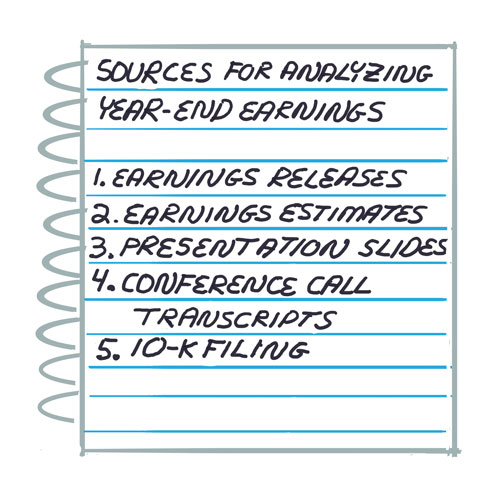 Here is what I look at:
-
Earnings Release: This is the bread and butter of corporate earnings announcements. The changes in revenues, net income and earnings per share that the company reports are the obvious key numbers to look at. I also scan through the company financial statements to compare how the various line items have changed on a year-over-year basis. I do this to identify any significant year-over-year changes in gross profit, debt, inventory, etc., that are worth investigating.
Dividend increases are also important for dividend-paying companies. For the stocks held in the AAII Dividend Investing (DI) model portfolio, I compare the latest dividend increase to past dividend increases. I want to know if the new increase is within the range of past increases, below it or above it.
-
Consensus Earnings Estimate: Ideally, reported earnings per share are above the average forecast by analysts at the time of the announcement. We define a positive or negative earnings surprise as reported earnings that are at least 2% above or below the consensus estimate.
If guidance about future earnings is provided, I compare that to analysts’ expectations as well. Ideally, the midpoint of guidance should be above expectations.
-
Earnings Presentation Slides: These are usually available in the investor relations section of a company’s website. Look for Events and Presentations or a similar heading. There is often additional information in these slides about the performance of each business segment, industry trends and management’s observations.
-
Conference Call Transcripts: I access these on SeekingAlpha.com. While investors can listen live or access a recorded version of the conference call on the company’s investor relations website, I prefer scanning through the transcript. I seek out color on the business trends, expectations for upcoming quarters and explanations of any notable year-over-year changes on the balance sheet. I scan both the executives’ prepared remarks and the Q&A session with analysts instead of reading the transcript word for word.
- Form 10-K: This is an annual filing required by the U.S. Securities and Exchange Commission (SEC). It is available in the SEC’s EDGAR online database. It provides more detail than the earnings release. The notes on the financial statements, for instance, will provide insights on why, say, inventory rose. The Form 10-K may also provide updated numbers on the percentage of revenues key customers accounted for. Large companies have 60 days after the end of their fiscal year to file their Form 10-K, while smaller companies have up to 75 days.
This type of analysis often takes less time than you might think. I can do all this in about 15 minutes if I’m not taking notes or looking more closely for explanations of changes I identified.

-
Detecting Earnings Manipulation With the M-Score
The eight variables in the M-Score model are designed to capture bloating or cosmetic changes made to a company’s financial statement numbers. -
How to Read a 10-K Filing
This annual report, required by the SEC, offers insight into a company’s business and the potential risks shareholders may face. -
The Individual Investor’s Guide to the Top Mutual Funds 2025
Investors were rewarded with gains from most fund categories in 2024, with growth and technology funds realizing the biggest returns. Get all the details in the March 2025 AAII Journal.
AAII Sentiment Survey
Optimism among individual investors about the short-term outlook for stocks declined in the latest AAII Sentiment Survey. Meanwhile, neutral sentiment and pessimism increased.
Bullish sentiment, expectations that stock prices will rise over the next six months, declined 4.9 percentage points to 28.4%. Bullish sentiment is below its historical average of 37.5% for the fifth time in seven weeks.
Neutral sentiment, expectations that stock prices will stay essentially unchanged over the next six months, increased 0.5 percentage points to 24.3%. Neutral sentiment is below its historical average of 31.5% for the 30th time in 32 weeks.
Bearish sentiment, expectations that stock prices will fall over the next six months, increased 4.4 percentage points to 47.3%. Bearish sentiment is unusually high and is above its historical average of 31.0% for the 11th time in 13 weeks. Bearish sentiment was last higher on November 2, 2023 (50.3%).
The bull-bear spread (bullish minus bearish sentiment) declined 9.3 percentage points to –18.9%. The bull-bear spread is below its historical average of 6.5% for the sixth time in eight weeks.
This week’s special question asked AAII members how they think tariffs will impact the economy.
Here’s how they responded:
- They will slow growth and increase prices: 57.3%
- They will have a temporary impact, but not a lasting one: 20.5%
- They will eventually lead to stronger domestic growth: 12.5%
- They will have a limited impact, if any: 5.3%
- Not sure/no opinion: 4.2%
Bullish: 28.4%, down 4.9 points
Neutral: 24.3%, up 0.5 points
Bearish: 47.3%, up 4.4 points
Bullish: 37.5%
Neutral: 31.5%
Bearish: 31.0%
See more Sentiment Survey results.

February 6, 2025 How Tariffs Could Affect U.S. Individual Investors
January 30, 2025 What Investors Should Know From Monday's AI Sell-Off
January 23, 2025 January Charts of Interest: Presidential Stock Market Scorecard
January 16, 2025 Where Market Indicators Stand as We Start 2025

Discussion
Barry J from TX posted over 1 year ago:
Thanks, Charles, for the tips. Assuming (1) it only takes 1 hour to complete your checklist and assuming (2) 100% comprehension of the data and (3) all cognitive biases are ignored, how many other investors do you estimate have already acted on this same information before any AAII investors can (4) click the buy button at a broker? I bet the number is larger than the number of AAII members @100,000. We may not like it, but we a governed by the semi-strong version of the efficient market hypothesis. The good news is that the math underlying Fama's EMHo theory also provides strong support that AAII value investors (who use investing processes similar to the 39 AAII guru screens) and who buy and hold those investments for 10 or more years have close to 100% odds of success according to research on EMHo by to several reputable academics and professional investors. See "Efficient Market Hypothesis" @wiki.com. That's a more productive use of that same one hour as panning for gold nuggets in 1850.
Barry from TX posted over 1 year ago:
Charles, the progression in the changes in the accompanying chart link in the AAII Sentiment Survey data are seismic over the last 22 surveys from 9/18/24 to 2/12/25. When was the last time a shift of this magnitude occurred? HOW did markets perform during the most similar period(s)? Comparisons might help us improve our ability to forecast. Psychologist Philip Tetlock's Superforecasters Project demonstrated that the accuracy of predictions (without feedback and learning) is no better than the Bernoulli brothers' famous coin flipping 300 years ago. Without feedback, our opinions are only as good as our best guess. Tetlock found that people who GET and USE feedback improve their forecasting accuracy far more than the general population. What are the odds of this happening over the next 6 months?
You need to log in as a registered AAII user before commenting.
Create an account