

January Charts of Interest: Presidential Stock Market Scorecard
by Charles Rotblut | January 23, 2025
Given Monday’s inauguration, I kick off this month’s charts of interest by examining how the stock market has performed under past presidents. I then discuss how U.S. stocks are now dominating global indexes, growth in the number of complex ETFs and rising home contract cancellations, before finishing with whiskey—yes, whiskey but not whisky. (There is a difference.)
As a reminder, charts of interest highlights charts and tables I’ve come across that have not made their way into other AAII commentaries but provide insights about the financial markets and the economy.
Stocks Have Risen Under Most Presidents
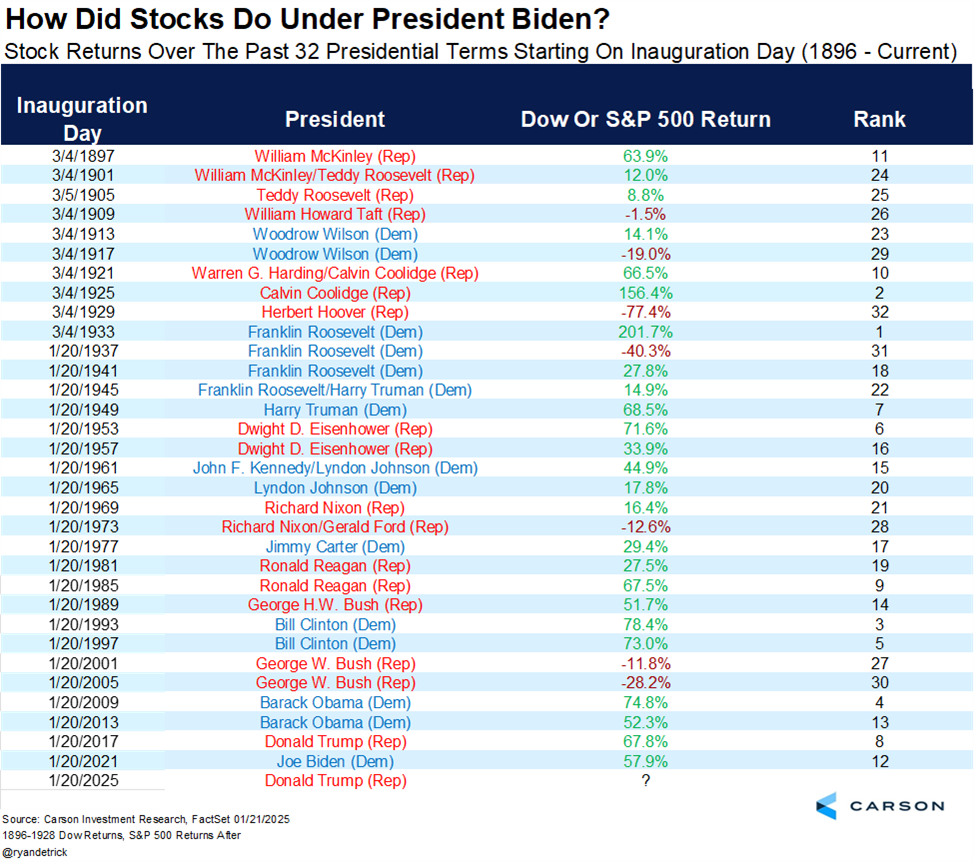
While both President Donald Trump (first term) and former President Joe Biden can accurately claim that stocks rose during their tenure, most past presidents can also do the same. Since the late 19th century, stocks have risen under most presidents, as this chart from Carson Group’s Ryan Detrick shows. Only six presidents have had stocks fall under their tenure.
“We Are the World”
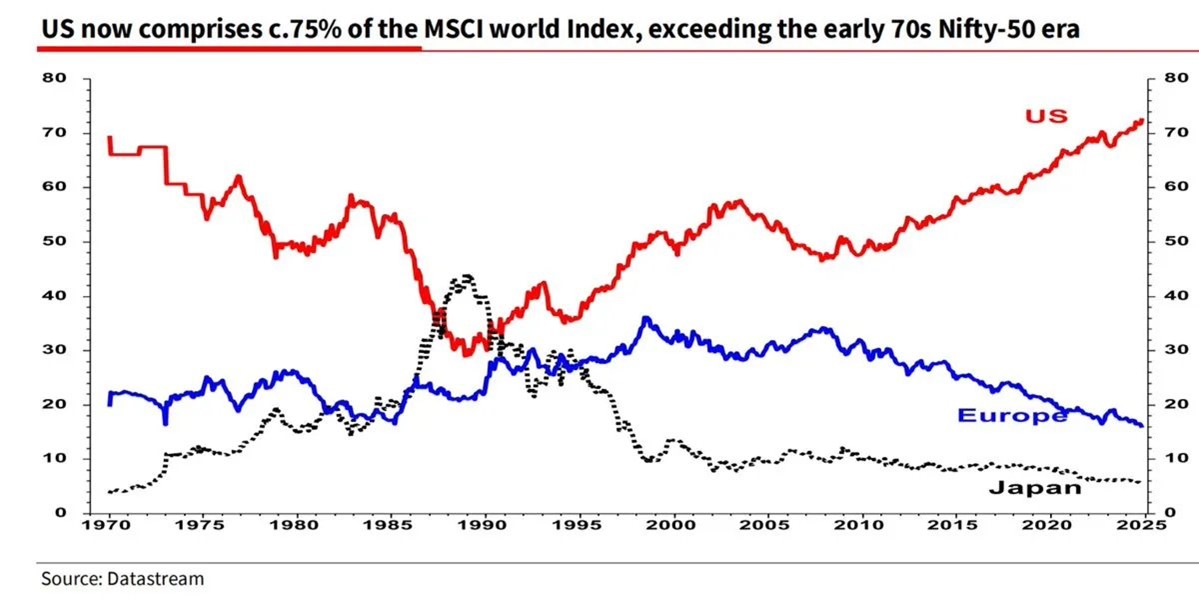
U.S. investors looking at global index funds might start singing the 1985 song referenced above. American stocks now account for three-quarters of the MSCI World index’s allocation. Topdown Charts’ Callum Thomas says the current weighting is now bigger than it was during the 1970s Nifty Fifty era.
If You Can’t Beat Them, Become More Complex
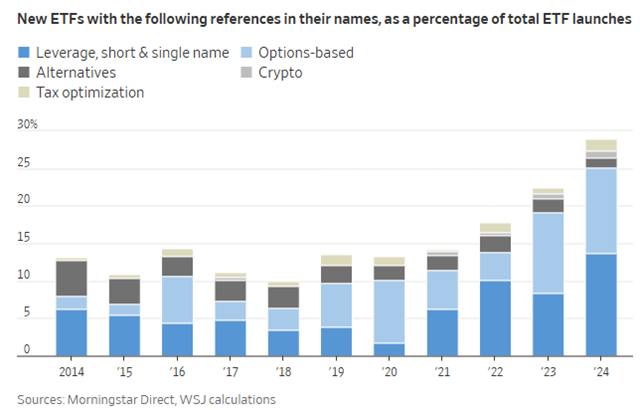
The market share for exchange-traded funds (ETFs) that track the best-known indexes is dominated by BlackRock (iShares), State Street and Vanguard. Most sectors, major industries and commonly followed factor strategies are also covered by established ETFs. To find avenues for new funds, Wall Street has gotten creative: “About 30% of ETFs launched in the U.S. in 2024 referred to some complex strategy in their names,” according to The Wall Street Journal.
A Record Number of Canceled Home-Purchase Agreements
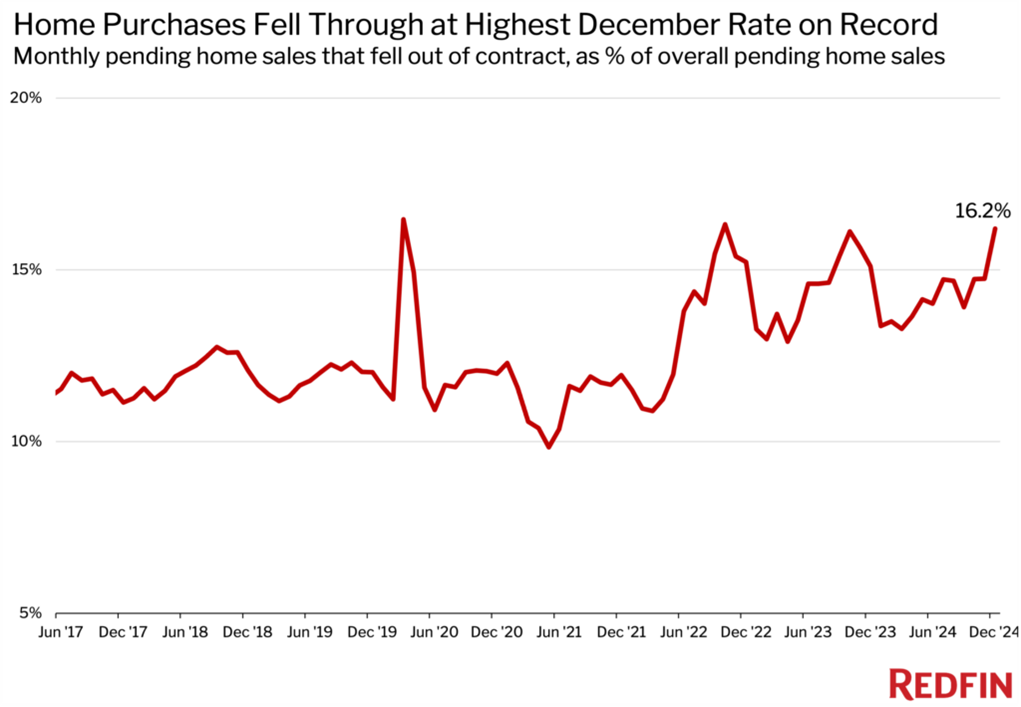
Nearly 40,000 home-purchase agreements were canceled in December 2024. This was the highest number of December cancellations since at least 2017, according to Redfin’s Lily Katz.
To put the percentage in perspective, it equated to 16.2% of homes that went under contract that month. To be fair, some of the cancelations could have been on homes that went under contract in November. Nonetheless, the high cancelation rate reflects the impact that rebounding mortgage rates are having.
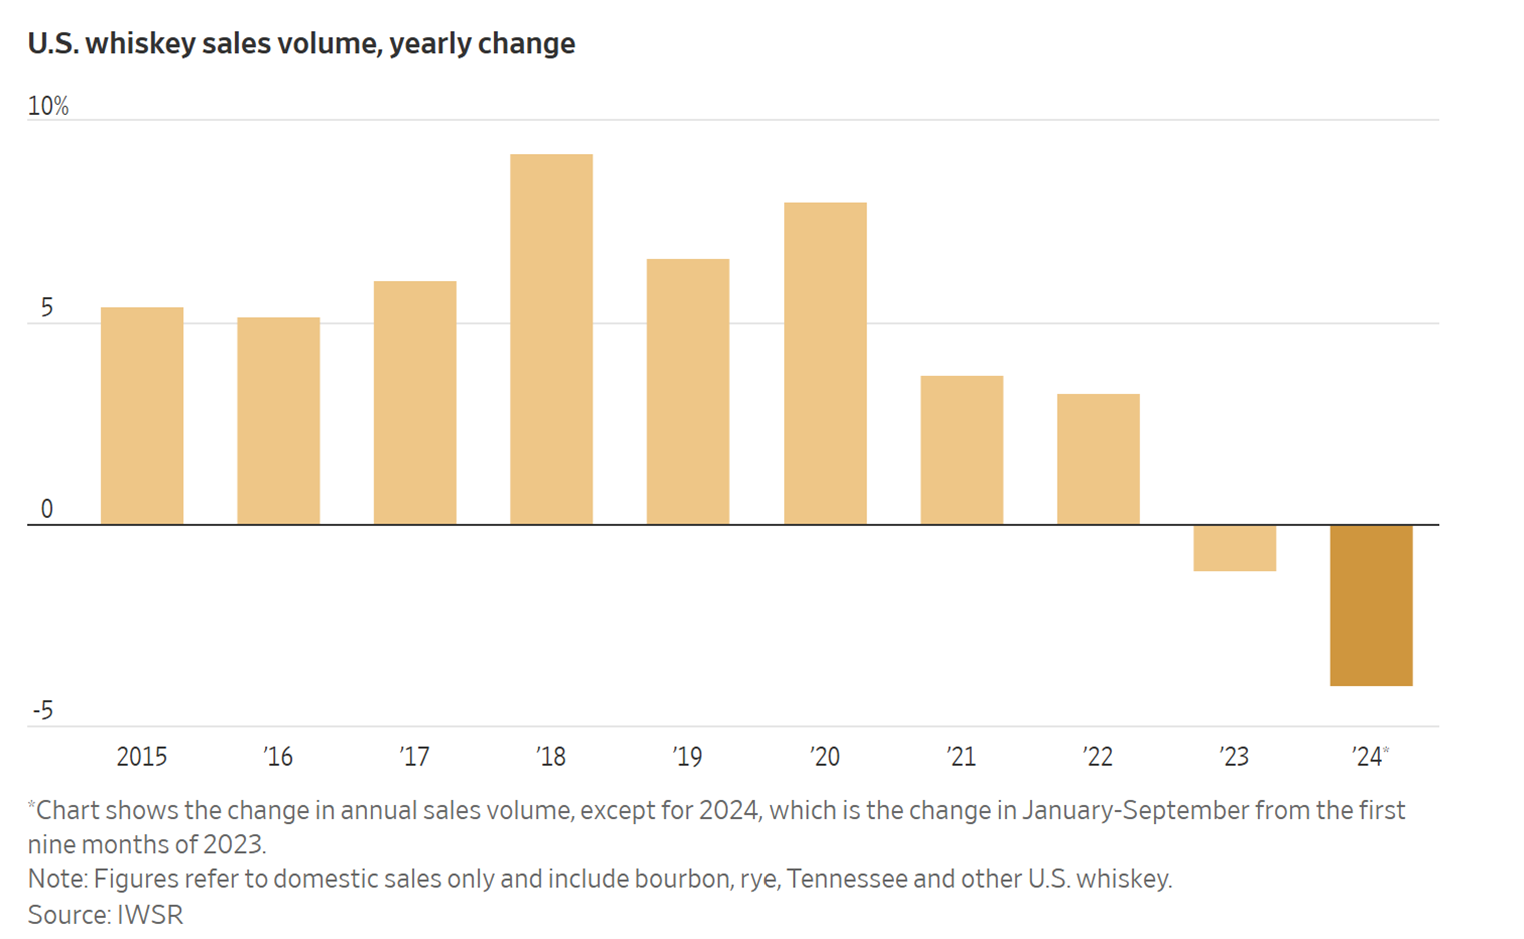
Whiskey Sales Are Drying Up
U.S. whiskey sales volume declined for a second consecutive year in 2024. It had previously risen every year between 2002 and 2022.
The Wall Street Journal cites a combination of a post-pandemic drop in spending, a shift toward lower-cost brands, and “the growing popularity of anti-obesity drugs, cannabis, and low- and no-alcohol drinks.” I’m partially to blame for letting my bottle of Woodford Reserve bourbon sit too long in the cabinet.

-
The Relationship Between a President's Party Affiliation and Stock Market Returns
Why we tend to elect Democratic presidents in times of trouble and Republican presidents in good times. -
Leveraged ETFs: Don’t Get Wiped Out by the Tail
Think carefully before buying a leveraged investment product that might seem highly attractive based on historical performance. Two key negatives are volatility drag and tail risk. -
A One-Page Wealth-Building Plan for College Savings
Creating a plan for funding college can help you clarify what choices you will make and keep you on track to meet your goal. Find out how in the January 2025 AAII Journal.
AAII Sentiment Survey
Optimism among individual investors about the short-term outlook for stocks increased in the latest AAII Sentiment Survey. Meanwhile, neutral sentiment and pessimism decreased.
Bullish sentiment, expectations that stock prices will rise over the next six months, increased 18.0 percentage points to 43.4%. Optimism is above its historical average of 37.5% for the first time in four weeks.
Neutral sentiment, expectations that stock prices will stay essentially unchanged over the next six months, decreased 6.9 percentage points to 27.1%. Neutral sentiment is below its historical average of 31.5% for the 27th time in 29 weeks.
Bearish sentiment, expectations that stock prices will fall over the next six months, decreased 11.1 percentage points to 29.4%. Pessimism is below its historical average of 31.0% for the second time in 10 weeks.
The bull-bear spread (bullish minus bearish sentiment) increased 29.1 percentage points to 14.0%. The bull-bear spread is above its historical average of 6.5% for the first time in five weeks.
This week’s special question asked AAII members what, if any, changes they expect to make to their portfolios this year.
Here’s how they responded:
- Focus more on portfolio income (more in dividend-paying stocks, more in bonds, etc.): 30.2%
- No changes anticipated: 28.9%
- Allocate more conservatively (more in bonds, more in cash, etc.): 19.5%
- Invest more aggressively (more in stocks, more in growth stocks, etc.): 17.5%
- Other: 3.4%
Bullish: 43.4%, up 18.0 points
Neutral: 27.1%, down 6.9 points
Bearish: 29.4%, down 11.1 points
Bullish: 37.5%
Neutral: 31.5%
Bearish: 31.0%
See more Sentiment Survey results.

January 16, 2025 Where Market Indicators Stand as We Start 2025
January 9, 2025 Stock Market History After Back-to-Back 20% Gains
January 2, 2025 2024's Most-Read Investor Updates: High Yields and Buying on Dips
December 19, 2024 December Charts of Interest: A Small-Cap Resurgence?

Discussion
Barry J from TX posted over 1 year ago:
Just call me Alice. Topic #1 on how stock market has performed under past presidents lead me down the rabbit hole and on a serpentine search of the AAII article database. I drank from the vial. I ate the cake. I started humming some Grace Slick. And I met some very strange characters with cryptic thoughts. One said, “it’s the economy stupid.” Another said, it’s Fed policy. Another proposed it’s the electorate’s job status on election day. The one that made me smile (from 2020) said It’s the weakness of the opponent that determines the election outcomes. Another was convinced that there is YOY variance. And – surprise -- all of them had their own model that spewed data that supported their opinions. Image that. What I learned was if you select and define your variables carefully, torture the data long enough, and set a low enough p-value, you will get an answer that “is significant” enough to meet your “get published” mandate and might lead to an AAII interview. A very similar process to being elected POTUS.
Charles Rotblut from US-0-IL posted over 1 year ago:
Barry, no comment about the bourbon? :) I included the table about the market's performance under each president simply because I found it interesting.
-Charles
Barry J from TX posted over 1 year ago:
Charles, #1 I passed on a comment on that chart (imagine that) because the numbers seemed unrealistic. The returns are 4 years added together. #2 What would be interesting (to me) would be the PERCENT TREND BY YEAR over EACH of the 4 years in office. #3 This would make it possible to COMPARE how well each POTUS did with what they inherited in Y0 and how well they delivered on platform promises by Y4. The chart provided has potential. It just needs a few more columns. #5 I remember a similar chart in Jeremy Seigel's "Stock for the Long Run "(2017) that had additional columns listing "significant factors" during each term. #6 I would add the columns for each of the 5 "STEEP" factors used at Harvard Business School for over 80 years (first by Alfred Chandler since 1962 and later after 1980 by Mike Porter until he retired) to paint a "chalk outline" of the zeitgeist of the times: S = [S]ocietal (I'd use Stauss-Howe generation markers and generational events); T = [T]echnologies (dominant trends, major innovations); E = [E]conomic (Macro: GDP growth, Fiscal policy (total Federal budgets and total debt growth), Monetary policy (FFR or interest rate changes); E = [E]nvironmental factors (natural disasters, temp change); and, P = [P]olitical events (wars, allies, alliances, adversaries, major events in significant countries). #7 Chalie Munger said that the people with better models know more and usually prevail. #8 Carson only provided one vector - total market change; I found it to be a very "limited" model for comparing performance. A more appropriate model to MAP and COMPARE CHANGE is matrix algebra. We need some eigenvalues (magnitudes) and an eigenvector (direction) to understand how each POTUS managed the changes he encountered "on his watch along the watchtower." Then we can rank 'em AND thank 'em OR spank 'em as appropriate. #9 Charles, likewise. No spirits were consumed during this comment, but 5 as PM nears, there is a cabernet somewhere nearby whispering my name. Cheers.
Andrew from NM posted over 1 year ago:
I'm glad to see whiskey consumption is down. Now maybe prices will start to follow. And hopefully wine prices, as well.
You need to log in as a registered AAII user before commenting.
Create an account