

Stock Market History After Back-to-Back 20% Gains
by Charles Rotblut | January 09, 2025
After two consecutive years with annual gains of more than 20%, is the S&P 500 index due to fall in 2025? It is a reasonable question to ask. I personally pondered the question as I prepared the slides for the AAII Dividend Investing (DI) presentation I gave on Tuesday (recording will be posted here).
Back-to-back years with gains greater than 20% among large-company stocks are infrequent but not rare. Such occurrences have happened nine times over the past 100 years, including 2023 and 2024.
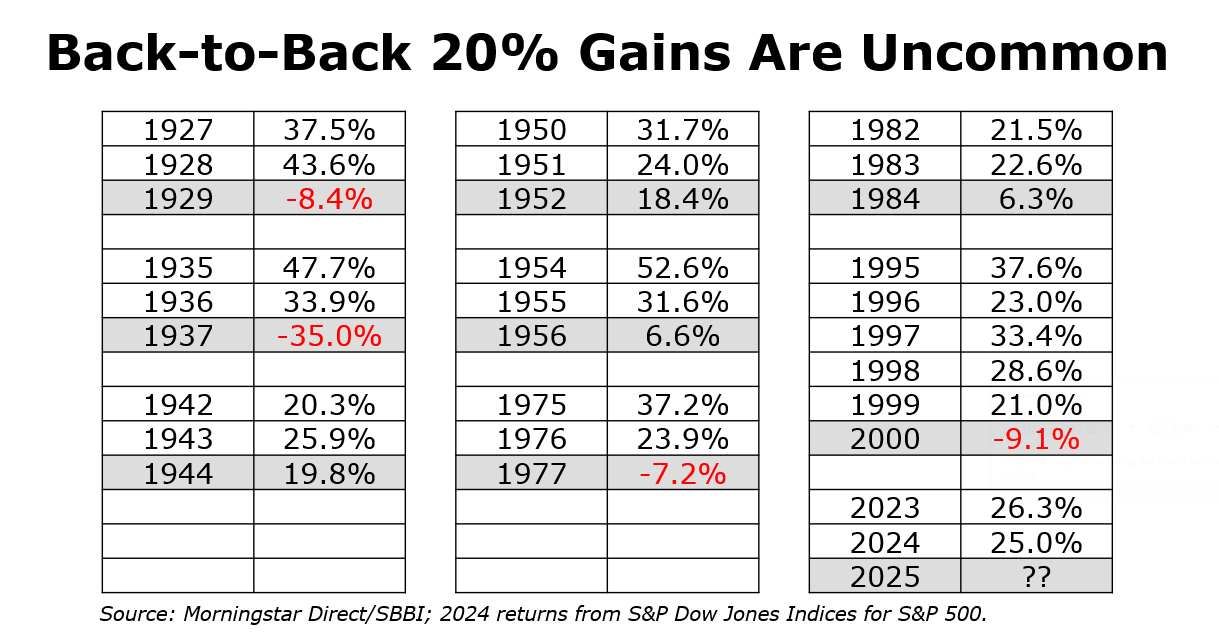
Let’s look at what happened after each of those occurrences.
- 1927–1928: Large-company stocks gained 37.5% in 1927 and 43.6% in 1928. The stock market crashed on October 24, 1929, (aka Black Thursday) and the Great Depression ensued. Notably, large-company stocks ended 1929 down just 8.4% for the full calendar year. The losses in 1930 and 1931 were far more substantial. Stocks, Bonds, Bills and Inflation (SBBI) large-company data is used for all periods prior to 2023 because the S&P 500 was not created until 1957.
- 1935–1936: The stock market staged a recovery rebound amid the Great Depression. Large-company stocks jumped 47.7% in 1935 and 33.9% in 1936. These gains were short-lived as a 35.0% drop followed in 1937.
- 1942–1943: Stocks have tended to do well during times of war; World War II was no exception. The demands of battle boosted economic production and stock prices reacted accordingly. Large-company stocks gained 20.3% in 1942 and 25.9% in 1943. The streak barely missed extending itself into a third year as stocks rose 19.8% in 1944.
- 1950–1951: The Korean War gave the U.S. economy another boost (even though war itself is terrible). Large-cap stocks rewarded investors with a 31.7% return in 1950 and a 24.0% return in 1951. The upward momentum remained strong in 1952 with large-cap stocks rising an additional 18.4%.
- 1954–1955: Following 1953’s modest 1.0% pullback, large-company stocks soared 52.6% in 1954 and 31.6% in 1955. The rally was aided by President Dwight Eisenhower’s ending of price controls. A modest 6.6% gain was realized the following year, 1956.
- 1975–1976: Twenty years passed before large-company stocks next rose by more than 20% on back-to-back years. The 37.2% gain in 1975 and the 23.9% rise in 1976 were rebounds from the 1973–1974 stock market crash. A 7.2% pullback in stock prices occurred in 1977 as inflation reaccelerated.
- 1982–1983: Federal Reserve chairman Paul Volcker’s strategy to rein in inflation led to a recession in the U.S., but investors cheered the move by sending stocks up 21.5% in 1982 and 22.6% in 1983. Large-company stocks gained a much more modest 6.3% in 1984 as inflation stayed in double-digits for one final year.
- 1995–1999: The release of web browsers, the launch of Yahoo’s search engine and rising sales of personal computers led to increased use of the internet. This combination fueled the dot-com bubble. During the five-year period of 1995 through 1999, large-company stocks gained 37.6%, 23.0%, 33.4%, 28.6% and 21.0%, respectively. The bubble popped in March 2000. Large-company stocks fell 9.1% that year before suffering bigger losses in 2001 and 2002.
- 2023–2024: Nearly a quarter century passed before we saw the S&P 500 rise 26.3% in 2023 and 25.0% in 2024. A pullback in inflation, increased adoption of artificial intelligence (AI) and post-pandemic economic growth all helped fuel the rally. What will follow those two good years remains to be seen.
The data clearly shows mixed returns for the calendar years following periods of consecutive 20% gains. Large-company stocks fell during four of those years: 1929, 1937, 1977 and 2000. During the other four years—1944, 1952, 1956 and 1984—they rose by single- and double-digit percentages.
Market commentators like to publish data demonstrating a pattern or trend. I personally think it is also useful to show when there isn’t a pattern or trend. Such is the case here. Past periods of back-to-back 20% gains in large-company stocks have been followed by a random walk of returns.

-
Stock Market Retreats and Recoveries
Only six months, on average, have separated the end of one decline and the start of the next one, but recoveries have been quick. -
The Relationship Between Stock Market Volatility and Returns
Less volatility isn’t always a good thing, especially when considering the returns that follow periods of high volatility. -
Trading Electronics for Homes in the Model Shadow Stock Portfolio
After the quarterly review of the Model Shadow Stock Portfolio, two stocks were removed and one stock was added.
AAII Sentiment Survey
Pessimism among individual investors about the short-term outlook for stocks increased in the latest AAII Sentiment Survey. Meanwhile, optimism and neutral sentiment decreased.
Bullish sentiment, expectations that stock prices will rise over the next six months, decreased 0.8 percentage points to 34.7%. Optimism is below its historical average of 37.5% for the second time in six weeks.
Neutral sentiment, expectations that stock prices will stay essentially unchanged over the next six months, decreased 2.4 percentage points to 28.0%. Neutral sentiment is below its historical average of 31.5% for the 26th time in 27 weeks.
Bearish sentiment, expectations that stock prices will fall over the next six months, increased 3.2 percentage points to 37.4%. Pessimism is above its historical average of 31.0% for the seventh time in eight weeks.
The bull-bear spread (bullish minus bearish sentiment) decreased 4.0 percentage points to –2.7%. The bull-bear spread is below its historical average of 6.5% for the fourth time in seven weeks.
This week’s special question asked AAII members how their portfolio performed in 2024 relative to their expectations at the beginning of the year.
Here’s how they responded:
- Much better than I expected: 21.9%
- Better than I expected: 45.6%
- Close to what I expected: 24.9%
- Worse than I expected: 6.1%
- Much worse than I expected: 1.5%
Bullish: 34.7%, down 0.8 points
Neutral: 28.0%, down 2.4 points
Bearish: 37.4%, up 3.2 points
Bullish: 37.5%
Neutral: 31.5%
Bearish: 31.0%
See more Sentiment Survey results.

AAII Asset Allocation Survey
Individual investors’ allocations to stocks increased while cash and bond allocations decreased in the December Asset Allocation Survey.
Stock and stock fund allocations increased 1.1 percentage points to 69.8%. Stock and stock fund allocations are above their historical average of 61.5% for the 55th consecutive month.
Bond and bond fund allocations decreased 0.7 percentage points to 14.6%. Bond and bond fund allocations are below their historical average of 16.0% for the 11th consecutive month.
Cash allocations decreased 0.4 percentage points to 15.6%. Cash allocations are below their historical average of 22.5% for the 25th consecutive month.
- Stocks and Stock Funds: 69.8%, up 1.1 percentage points
- Bonds and Bond Funds: 14.6%, down 0.7 percentage points
- Cash: 15.6%, down 0.5 percentage points
- Stocks: 31.2%, down 0.3 percentage points
- Stocks Funds: 38.6%, up 1.4 percentage points
- Bonds: 4.3%, down 0.5 percentage points
- Bond Funds: 10.4%, down 0.2 percentage points
- Stocks/Stock Funds: 62.0%
- Bonds/Bond Funds: 16.0%
- Cash: 22.0%
Take the Asset Allocation Survey.
January 2, 2025 2024's Most-Read Investor Updates: High Yields and Buying on Dips
December 19, 2024 December Charts of Interest: A Small-Cap Resurgence?
December 12, 2024 S&P 500 Stocks With the Potential to Outperform in 2025
December 5, 2024 Five Smart Strategies to Reduce Your 2024 Capital Gains Taxes

Discussion
Lisanne Pearcy from OR posted almost 2 years ago:
It would be interesting to consider what the valuations were for large cap stocks in each of these years.
Karl from WV posted almost 2 years ago:
It is interesting to note that there were four two year periods of greater than 20% returns in the 1990s (periods ending in 96, 97, 98, and 99) yielding a total of 11 such periods prior to 2020. Of these 11 periods, only one was followed by a year of greater than 10% negative returns while 5 were followed by years of 18% or more.
Barry J from TX posted almost 2 years ago:
Happy New Year Charles and AAII staff. We get to do our “das ding” thing all over again. That’s better than option 2. I have comments on a few things that have occurred between Christmas and Epiphany. #1 The AAII Premium Portfolio reviews I viewed provided excellent data and analysis to assist with investing decision in 2025. Thanks. #2 I recently re-read several AAII articles on Factor Investing. They may be the best in the AAII library. Anyone who wants to understand how the 55 AAII stock screening strategies complement each other as a broad coherent investing strategy and can be used to produce a diversified portfolio should read them. They address factors that have been proven to produce market anomalies - Size (Sm-caps), Value + Profitability, Growth + Momentum, and Quality (Value + Momentum). #3 Today’s post reminded me to re-read “Part I Stock Returns:? Past, Present, and Future” of Jeremy Siegel’s “Stocks for the Long Run,” 2014. Prof. Siegel paints a progression over the same periods as you do, but he connects major market variations to key events in the economic and geopolitical environment. For example, he sees the 2008-2009 Great Recession as a watershed event generated by an accumulation of forces as past events (there's that "das ding" thing again) having ripple effects forward (Chapters 2 and 3). #4 Channeling Mandelbrot I, too, see a leptokurtic progression of unattenuated fat tails. Translation: It ain't over yet. #5 The final probabilities in your review are a coin flip between equal odds for 4 good years or 4 bad years following YOY good SPX years. You closed with these sentences: #6 “What will follow those 2 good years remains to be seen. The data clearly shows mixed returns for years following periods of consecutive 20% gains. #7 “Past periods of back-to-back 20% gains in large-company stocks have been followed by a random walk of returns.” #8 Was Pharaoh’s 2 dreams in Genesis 41:1-57 your inspiration for this? Jacob’s interpretation of the dreams foretold 7 years of abundance followed by 7 years of famine. Similar to an AAII “buy and hold” philosophy toward the flow of markets (similar to the flow of the Nile in the 2 dreams) Jacob advised Pharoah to collect, store, and guard 20% of crops [returns] during good years so there will be enough to eat when famine came. It did, but Egypt had plenty of food, and people came to buy grain. #9 Maybe you should write a column on “How Buy and Hold Begets Buy Low, Sell High opportunities.
CSarahan from VA posted almost 2 years ago:
Interesting. If the 90s were broken out, you would have different results. I put a quick chart together for the given breakouts. Random walk indeed but a slight nod to the positive side of ledger. Full caveat, this is limited data set and it treats is data point as independent which we know is not how cumulative returns work. My best guess, and it is one, that this year will be between -7% to 7%. We'll all know around 12/31/25. -35.00% 0.00% Avg Loss: -14.93% -9.10% -9.10% Med Loss: -8.75% -8.40% -8.40% Avg Loss w/o Outlier: -8.23% -7.20% -7.20% Med Loss w/o Outlier: -8.40% 6.30% 6.30% Avg Gain: 12.78% 6.60% 6.60% Med Gain: 12.50% 18.40% 18.40% Avg Gain w/o Outlier: 10.43% 19.80% 0.00% Med Gain w/o Outlier: 6.60% -8.60% 6.60% Total G/L over Data Set
Barry from TX posted almost 2 years ago:
Jason Zweig's column today reminded us when we are asked to guess or forecast a number, whatever we say creates an ANCHOR in our minds that influences future estimates. System 1 associative mechanisms can be programmed by suggestion (an old mind-reader and card shark trick). For example, in the post above, the +7% to -7% interval could create an anchor that makes a 20% return in 2025 look less probable.
Barry from TX posted over 1 year ago:
If you wish to review more market forecasts, Christine Benz of Morningstar published an article today (1/13/25) summarizing 10-year forecasts by major brokers, entitled "2025 Stock and Bond Returns Forecast from Vanguard, BlackRock, Fidelity, Schwab, More." Spoiler alert: long-term return expectations dropped across major asset classes.
DAVID from NV posted over 1 year ago:
Given the enormous number of alleged "market experts" who, apparently, are making so much money investing that they now have time to jump into social media, podcasts, and television and offer their version of "the sky is falling" or "here is the next gazillion dollar stock," I find the stock market sways to the immense gullibility of investors that listen to all of that garbage. Include day traders and Robinhood investors who decide it is time to resurrect Polaroid film stock and mess with the stock market just for fun and the stock market is chaos. We see the market move 10% on someone's opinion? Finally, add in a president elect that spends his time thinking about what purely ridiculous, completely false lie he can spew just to get attention, regardless of what it does to damage the economy, and I understand why people buy fixed income investments.
Jim from UT posted over 1 year ago:
When does an index no longer become an index? It seems that at least in recent years, we're comparing the performance of different screens and portfolios etc against the performance of 7 stocks. I wonder what this data would look like for an equal weighted S&P 500.
John L from NJ posted over 1 year ago:
The number of comments for this reasonable article demonstrate the unhealthy interest in annual stock market forecasts. And this despite year after year of most annual forecasts being incorrect. Investing is not a one year activity. For long term investors it doesn't matter what the market does in 2025. Stay the course to achieve long term objectives. DAVID - Tune out all the nonsense in the media and social websites. None of it matters to long term investors.
You need to log in as a registered AAII user before commenting.
Create an account