

S&P 500 Stocks With the Potential to Outperform in 2025
by Charles Rotblut | December 12, 2024
Featured Tickers: ALB
APA
DVN
FICO
NRG
TRGP
UAL
ALB
APA
DVN
FICO
NRG
TRGP
UAL
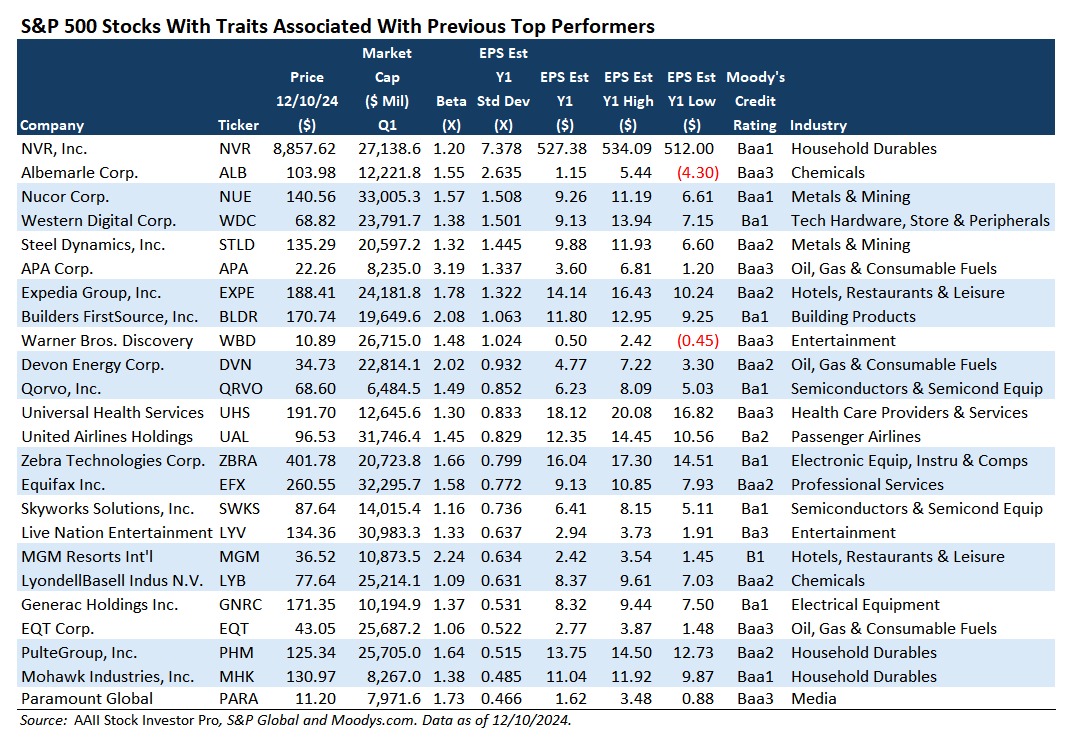
S&P 500 index stocks with characteristics of past top performers were shown in the January 2024 First Cut. The AAII Journal article was based on Martin Fridson’s book “The Little Book of Picking Top Stocks: How to Spot Hidden Gems” (Wiley, 2023). I updated the list this week.
 Fridson analyzed the S&P 500’s previous best-performing stocks to determine if there were common traits among them. He identified five such traits: a high level of dispersion in analysts’ estimates, smaller relative size for large-cap stocks, relatively high levels of volatility, below-top-notch credit ratings and a catalyst to cause the price to move.
I screened for dispersion in earnings estimates, size and volatility. Credit ratings were pulled from the Moody’s website. There isn’t a way to quantitatively screen for catalysts. Nonetheless, several big winners were found. Through yesterday morning, United Airlines Holdings Inc.  (UAL) jumped 132% over the past 12 months, Targa Resources Corp. (TRGP) surged 115%, Fair Isaac Corp. (FICO) gained nearly 91% and NRG Energy Inc. (NRG) powered up by more than 89%.
Fridson cautioned that stocks with the potential to have a great year also have the potential “to have a very bad year.” Such was the case with oil and gas companies APA Corp. (APA) and Devon Energy Corp. (DVN). The two stocks respectively lost 38% and 24% of their value over the past 12 months. Albemarle Corp. (ALB) dropped 31% due to falling commodity prices. Constantly swinging for the fences will lead to your share of strikeouts.
Overall, eight of the stocks listed in the January 2024 First Cut article have outperformed the S&P 500 over the past 12 months. The average return for the passing stocks was 21.5%, versus the S&P 500’s return of 26.6% through Tuesday, December 10. As noted above, we could not screen for catalysts. Including this step from Fridson’s list may have weeded out some of the underperformers.
I ran the screen this week to identify stocks with the potential to be the S&P 500’s top performers. I then removed stocks rated A or better by Moody’s, as well as those not rated by the credit agency. This left 24 stocks with traits of past top-performing S&P 500 stocks. While there are some carryovers, most of the companies on this list didn’t appear on the January 2024 list.
The strategy behind the screen is speculative. Fridson suggested putting no more than 1% or 2% of your portfolio into a stock you believe could be next year’s top performer in the S&P 500.
Alternatively, you could use the list as a starting point to identify stocks that may be worth holding for longer. This would require spending time examining the stocks’ underlying fundamentals and valuations—factors that the screen does not consider.

-
What Helps and Doesn't Help Find Top-Performing Stocks
Martin Fridson shares what drives stocks to be the number-one stock in the S&P 500 in terms of one-year returns is surprises. -
The S&P 500 Outcasts: Picking Up the Dropped Stocks
A starting point for investors. A focus on stocks possibly neglected due to their removal from the S&P 500 index. -
Guide to Tax on Your Personal Investments 2024
An online-only supplement to our recently released annual tax guide that explains the tax rules regarding the buying and selling of securities.
AAII Sentiment Survey
Optimism among individual investors about the short-term outlook for stocks decreased in the latest AAII Sentiment Survey. Meanwhile, neutral sentiment and pessimism increased.
Bullish sentiment, expectations that stock prices will rise over the next six months, decreased 5.0 percentage points to 43.3%. Optimism is above its historical average of 37.5% for the 56th time in 58 weeks.
Neutral sentiment, expectations that stock prices will stay essentially unchanged over the next six months, increased 4.0 percentage points to 25.0%. Neutral sentiment is below its historical average of 31.5% for the 22nd time in 23 weeks.
Bearish sentiment, expectations that stock prices will fall over the next six months, increased 1.0 percentage points to 31.7%. Pessimism is above its historical average of 31.0% for the third time in four weeks.
The bull-bear spread (bullish minus bearish sentiment) decreased 6.0 percentage points to 11.7%. The bull-bear spread is above its historical average of 6.5% for the 30th time in 32 weeks.
This week’s special question asked AAII members how they think the average consumer is faring relative to one year ago.
Here’s how they responded:
- Better: 31.3%
- About the same: 35.1%
- Worse: 32.1%
- Not sure/no opinion: 1.5%
Bullish: 43.3%, down 5.0 points
Neutral: 25.0%, up 4.0 points
Bearish: 31.7%, up 1.0 points
Bullish: 37.5%
Neutral: 31.5%
Bearish: 31.0%
See more Sentiment Survey results.

December 5, 2024 Five Smart Strategies to Reduce Your 2024 Capital Gains Taxes
November 28, 2024 Thanksgiving Conversations: Planning for the Future
November 21, 2024 November Charts of Interest: The S&P 500 Returns Under Republican Control
November 14, 2024 Unawareness of Cognitive Impairment Reduces Your Wealth

Discussion
Barry from TX posted almost 2 years ago:
Charles, Frison is a pure speculative “beta” strategy. The main question is, what are the odds for your horse to win? From the tout sheet you prepared for us, we (1) pick THE horse (odds = 1 in 24) that is (1) smaller than half the other horses (odds = 1 in 2) AND (2) bet that the overall market variance (beta or SD) will be sufficiently positive to produce a multiplier effect that exceeds ALL other multipliers (odds =1 in 24) AND (3) the positive beta will produce the EPS with the largest deviation of all EPS surprises throughout the year (odds = 1 in 24). Overall odds = 1 in 1,152 ... OR ... about twice the odds of throwing a dart blindfolded at a list of SPX 500 stocks (odds = 1 in 500) ... OR ... about 1,152 times the odds if you just buy a Total SPX 500 Market ETF that tracks SPX performance (odds = 1 in 1). But what’s the fun in playing the odds? Answer: money and peace of mind. Fun is where you find it. As the Eagles sang in "The Sad Cafe" in 1979, "I don't know why fortune smiles on some and lets the rest go free." Discuss among yourselves.
Barry from TX posted almost 2 years ago:
The article says "Fridson analyzed the S&P 500’s previous best-performing stocks to determine if there were common traits among them. He identified 5 such traits: 1) a high level of dispersion in analysts’ estimates, 2) smaller relative size for large-cap stocks, 3) relatively high levels of volatility, 4) below-top-notch credit ratings, and 5) a catalyst to cause the price to move." That parallels the profile of the small-cap value stocks that fell apart in late 4Q24. The first Platinum Weekly Upttae (1/4/24) reported the scope and depth of the damage to all PFs, including DIV. Characteristic #4 - below-top-notch credit ratings -- ran into the Fed announcement that it would only have two FFR cuts in all of 2025. Sometimes you eat steak. Sometimes Mr. Markert eats steak. Rising economic LEIs would go a long way to turning this around
You need to log in as a registered AAII user before commenting.
Create an account