



Related

Exchange-Traded Funds
Think carefully before buying a leveraged investment product that might seem highly attractive based on historical performance. Two key negatives are volatility drag and tail risk.

Any investor could be tempted by a fund that offered high double-digit yields or historical average annual returns of 45% per year. Any speculator could be enticed by a fund that could make 30% or more in one day.
Leveraged and inverse exchange-traded funds (ETFs) and exchange-traded notes (ETNs) offer all this and more. However, it is critically important that you educate yourself before purchasing these investments. Not only do leveraged investments tend to underperform in choppy markets, but they leave the investor with the possibility of a catastrophic loss. In this article, I explain these two major risks and how to identify and minimize, if not altogether avoid, these risks in your portfolio.
Investors can now buy a wide range of products that offer leverage, including leveraged ETFs, leveraged ETNs and leveraged mutual funds. I call the collection of these leveraged investment products (LIPs). I do not include leveraged closed-end mutual funds (CEFs) because CEFs tend to use less leverage and manage their leverage differently than what I will describe. However, the risks I characterize apply to some types of leveraged CEFs as well.
LIPs provide the investor with a leveraged exposure to a market or sector index, with leverage typically ranging from negative two times to positive three times (–2x to 3x). (There are a few 4x-leveraged currency ETFs as well.) For example, a 3x LIP would invest $3 in an index for every $1 invested in the product. On a given trading day, the 3x LIP would earn 3% (minus product expenses) for every 1% return in the index. LIPs with negative index exposure are called inverse LIPs and profit from a decline in the index.
In my experience, most investors use LIPs for three primary purposes:
LIPs offer some advantages compared to investors employing leverage themselves through margin brokerage accounts. LIPs often borrow at lower rates than are available to many individual investors. Investors who buy securities on margin face the threat of margin calls that can result in fire-sale liquidation of portfolio holdings in adverse markets. LIPs, on the other hand, limit an investor’s risk to their investment and thus can be used to avoid a broader portfolio impact.
For investors wishing to profit from the decline of a market index or sector, inverse LIPs limit investor loss to their LIP investment amount. In contrast, direct short selling requires borrowing securities and leads to a potentially unlimited investor liability. Therefore, inverse LIPs offer an additional tool for hedging risk and profiting from market declines.
LIPs target a set leverage factor that they maintain by trading on either a daily basis or, for some products, a monthly or quarterly basis. Any price change in an index leads to a deviation from the targeted leverage factor that LIPs must correct through rebalancing their portfolio. Portfolio rebalancing requires LIPs to buy high and sell low to maintain their targeted leverage. For example, if the price of an index increases, an LIP will increase its index exposure (i.e., buy) to maintain targeted leverage. Similarly, if the price of an index decreases, an LIP will decrease its index exposure (i.e., sell) to maintain targeted leverage.
Leveraged ETFs and leveraged mutual funds invest in the index’s securities and experience tracking errors due to rebalancing trades. Leveraged ETNs, on the other hand, are managed by a sponsor who pays an investor the theoretical leveraged index performance minus an annual expense. Although leveraged ETNs avoid tracking error, an investor purchasing them takes on added risk from potential sponsor bankruptcy.
We can see the allure of LIPs by examining two different products. One has performed spectacularly while the other ended in liquidation.
At roughly $4 billion in net assets, ProShares UltraPro QQQ  (TQQQ) invests in the Nasdaq 100 index on a 3x-leveraged basis and is a prime example of a leveraged ETF that has succeeded over the long term. Invested in large-cap technology stocks, ProShares UltraPro QQQ has benefited from this sweet spot of our economy.
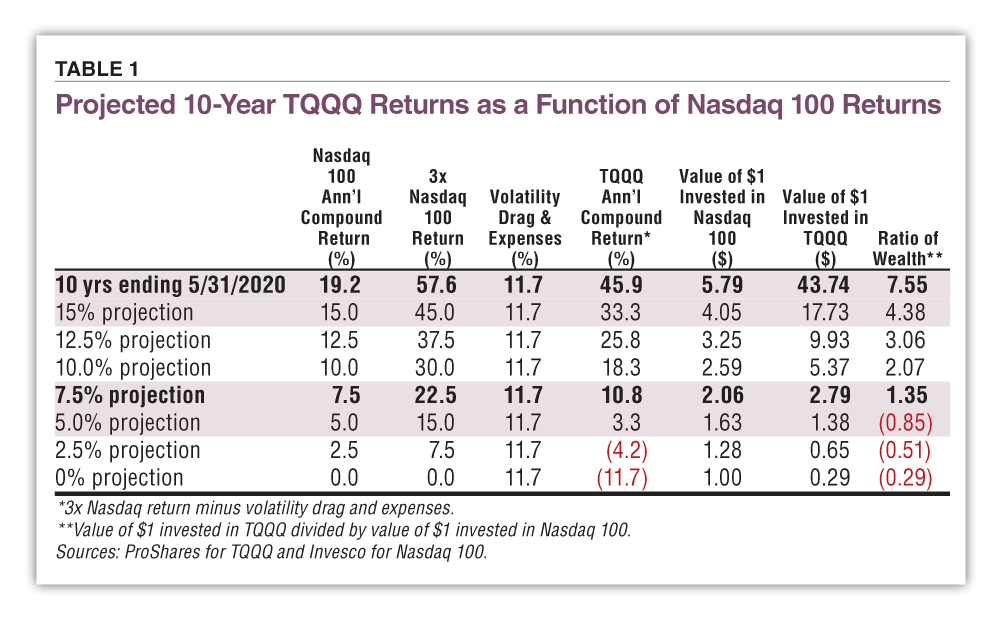
As of May 31, 2020, ProShares UltraPro QQQ has an average annual market return of 45.9% per year over the past 10 years (according to ProShares) compared to an average annual return of 19.2% per year for the Nasdaq 100 (according to Invesco). ProShares UltraPro QQQ has made more than 3x the Nasdaq 100 on a cumulative basis. One dollar invested in ProShares UltraPro QQQ would have grown to $43.74 over 10 years versus $5.79 for the Nasdaq 100.
This tremendous return rivals some of the world’s top investors at their peak performance. Nevertheless, I would highly caution investors regarding the risks of buy-and-hold investing in ProShares UltraPro QQQ and similar LIPs going forward for reasons I soon explain.
On the other side of the spectrum, consider the UBS ETRACS Monthly Pay 2xLeveraged Mortgage REIT ETN (MRRL). As of December 2019, this 2x ETN was offering a 15%+ yield in a world where 10-year U.S. Treasury bonds are yielding less than 2%. What’s more, in February of 2020, this ETN’s price was trading slightly above its 2015 IPO value of $15, so over the past four-plus years, IPO investors collected this handsome yield without deterioration of their capital base.
Unfortunately, the story of UBS ETRACS Monthly Pay 2xLeveraged ended badly. It invested in mortgage real estate investment trusts (REITs) that themselves owned mortgages on a leveraged basis. As investors started to realize the full impact of the coronavirus pandemic, the value of these mortgages declined substantially relative to the interest rate hedges used by the mortgage REITs, which resulted in a sharp drop in the mortgage REIT index. On March 17, 2020, UBS announced the liquidation of the ETN, with a final Nasdaq trading price of $0.21 on March 24, 2020.
And UBS ETRACS Monthly Pay 2xLeveraged was not an isolated example—a host of leveraged high-income ETNs were redeemed (i.e., liquidated) focusing on sectors such as homebuilders, equity REITs, business development companies (BDCs), master limited partnerships (MLPs) and other high-dividend stocks in March 2020.
In hindsight, the success of ProShares UltraPro QQQ and the failure of UBS ETRACS Monthly Pay 2xLeveraged might appear obvious. However, I would argue that hindsight is 20/20 and that either investment could have become impaired. Moreover, I believe that more LIPs will eventually become impaired, even those that have done well in the past like ProShares UltraPro QQQ. My reasoning will become clear as I describe two key negatives of leveraged investing: volatility drag and tail risk.
Volatility generally refers to up and down price moves in an investment, but specifically it is a measurement corresponding to a standard deviation of percentage investment returns. Although often calculated on a shorter-term basis (daily, weekly or monthly), volatility is typically quoted in annualized terms, providing an idea of how much an investment might fluctuate over a year.
When an investment has higher volatility, the compound return (the return you actually earn) decreases versus the average arithmetic return. For example, consider an investment that increases 10% one day and decreases 10% the next. One dollar invested would be worth $1.10 after day one and $0.99 ($1.10 (AAPL) 0.90) after day two. The arithmetic average return is 0%, and yet the investor has lost 1%.
LIPs amplify this effect, which has been called volatility drag or volatility decay. Using our same 10% and –10% daily returns, a 3x-leveraged ETF would have a gain of 30% on day one and a loss of 30% on day two. One dollar invested would be worth $1.30 after day one and $0.91 ($1.30 (AAPL) 0.70) after day two. The arithmetic average return is 0%, and yet the investor has lost 9%!
The effect of volatility drag on an LIP’s compound return can be approximated by subtracting a term proportional to the squared volatility. The volatility drag of leveraged investments is well known among researchers and came to the fore after the financial crisis of 2008–2009. It is why some professional investors avoid owning LIPs and even sell short LIPs to take advantage of the effect.
And yet, if there is volatility drag, why have LIPs like ProShares UltraPro QQQ had such excellent long-term performance? The key is having a high compound return for the index. If the compound return for an index is high enough, the multiplication of that return can more than offset the negative effect of volatility drag.
I show this in Table 1, which provides the historical performance of ProShares UltraPro QQQ in the top row and my projections for future performance in the succeeding rows. The annual ProShares UltraPro QQQ compound return of 45.9% is well below three times the index return of 19.2% as a result of volatility drag and product expenses. However, the compound return itself is so high that its cumulative effect over 10 years is a massive wealth increase, leading to more than seven times the wealth of owning the Nasdaq 100.
The 11.7% value for volatility drag & expenses is calculated as three times the Nasdaq 100 compound return minus the actual compound return of ProShares UltraPro QQQ. Assuming a similar level of volatility and expenses going forward, in Table 1 we keep this value constant to project future ProShares UltraPro QQQ returns as a function of Nasdaq 100 returns. Later, I estimate returns based on different forward-looking volatility assumptions.
Note that my projected return range for the Nasdaq 100 (0% to 15% compound returns) is lower than the historical 19.2% return for the Nasdaq 100. I used more conservative assumptions for several reasons, including the fact that the Nasdaq 100 owns large-cap technology stocks like Apple Inc. (AAPL) and Microsoft Corp. (MSFT) that are unlikely to grow at 19% indefinitely.
Looking at the projections in Table 1, we see the attractiveness of ProShares UltraPro QQQ substantially diminishes given more moderate return expectations going forward. If the Nasdaq 100 has a compound annual return of 5% per year, ProShares UltraPro QQQ underperforms the Nasdaq 100. If the Nasdaq 100 earns 2.5% or lower, the ProShares UltraPro QQQ loses money. If the Nasdaq 100 has flat returns, the ProShares UltraPro QQQ loses 71% ($0.29 – $1.00) of its value!
Even if you expect the Nasdaq 100 to continue to have high returns, Table 1 doesn’t show us the elevated risk of a ProShares UltraPro QQQ investment, a point I explore in the next section.
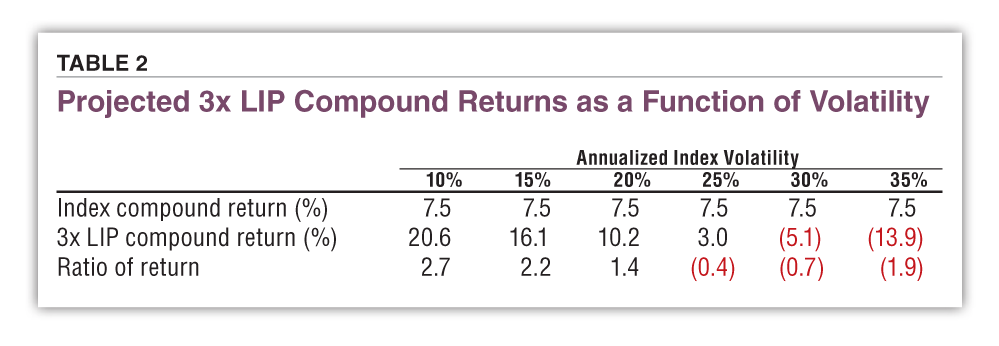
We don’t have to assume that volatility remains the same but can project LIP returns as a function of volatility. Using my base-case return of 7.5% and a second-order approximation formula from my Journal of Index Investing article, I project LIP returns as a function of volatility in Table 2.
Note that Table 2 applies to a 3x LIP invested in any index (not just the Nasdaq 100) but does not factor in product expenses such as expense ratio, borrowing costs and tracking error. Product expenses would result in further deterioration in relative LIP performance.
For volatility in the 10% to 20% range, the 3x-leveraged return looks reasonably attractive, but prospects become poor as volatility increases above 20%, underperforming the index at 25% volatility and having negative returns for 30% and 35% volatility.
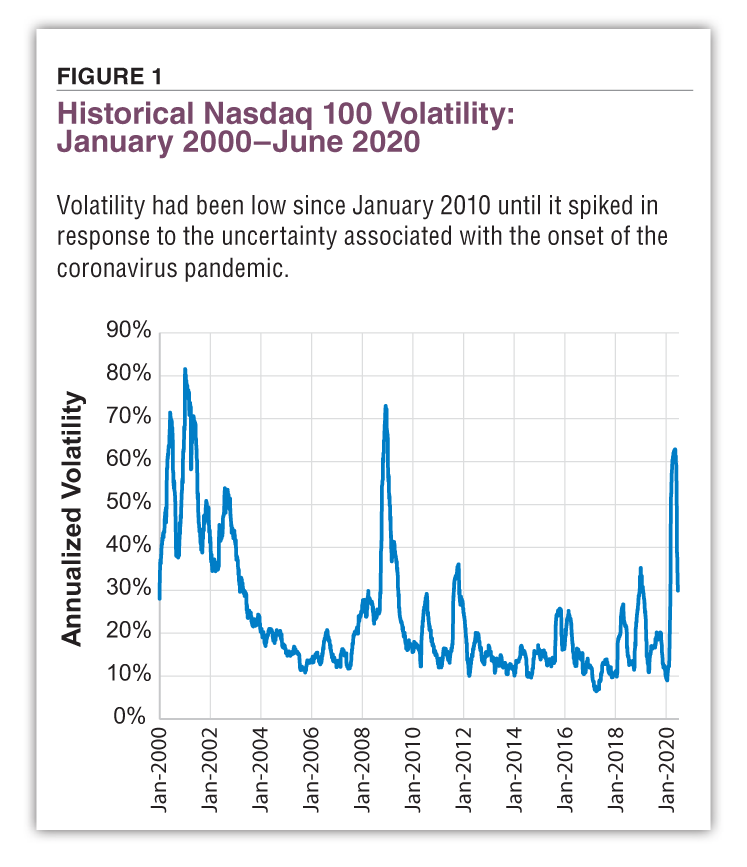
For a point of reference, in Figure 1 I’ve plotted the historical Nasdaq 100 volatility since 2000. Although volatility had been low since January 2010, it has spiked with the onset of coronavirus pandemic uncertainty. Should volatility remain at elevated levels, I would expect ProShares UltraPro QQQ to underperform.
Generally speaking, tail risk is the risk of an extreme event. In the context of investing, tail risk corresponds to the threat of a large negative return. Figure 2 graphs a hypothetical LIP return probability distribution to illustrate the concept. The probability that a return will occur within a given range is the area under the probability distribution curve in Figure 2. The “tails” of a probability distribution are the right and left extremes of the graph, so named because they look like tails. The tails correspond to less likely and more extreme outcomes. In our case, this means large positive or negative returns.
LIPs greatly magnify tail risk, as they enlarge gains and losses by the leverage factor (–2x to 3x)?a 30% loss at 3x leverage transforms into a 90% loss. Such massive losses can lead to LIP liquidations (as occurred in March 2020) or a steep decline that is difficult to recover from?for example, a 90% loss requires a 900% return to get back to even. What’s more, as LIPs have to buy high and sell low, they do not fully benefit from the recovery of a steep loss due to a reduction in the amount LIPs have invested “at the bottom.” In other words, a sharp, temporary loss in a given index could lead to permanent impairment of an LIP invested in that index.
In my Journal of Index Investing article, I found significant tail risk in the monthly returns of LIPs. Index returns exhibited the statistical properties of negative skew (losses) and excess kurtosis (a higher probability of abnormal returns), leading to an elevated left tail and the likelihood of a large negative loss. Intuitively, this corresponds to the trading adage “Markets go up on an escalator and down on an elevator,” as stock indexes can have sharp, sudden drops.
Examining hypothetical 2x LIPs invested in eight stock market indexes over 20 years, I found that five of the eight LIPs would have had monthly losses of 60% or greater. This would have resulted in product liquidations based on the terms of certain LIPs that reset their leverage monthly or quarterly. Thus, I was not surprised by the large number of LIP liquidations in March 2020, as I had already predicted a high likelihood of liquidations to eventually occur. (Hypothetical LIPs were used because actual monthly 2x LIPs did not exist over the complete time period.)
I also calculated maximum drawdown, defined as the maximum percent loss of capital from a prior peak. I found the average maximum drawdown to be 91%, with volatile sector 2x LIPs having maximum drawdowns of 97% or higher.
This result demonstrates the tail risk of LIPs?a potentially devastating loss of capital with no guarantee that you will ever recoup your loss.
Leverage investment tail risk comes from the potent mix of high volatility and high leverage. The key to reducing tail risk is to avoid this dangerous combination.
LIP investors may not appreciate the tail risk that was taken to achieve high historical returns. Even if certain LIPs have been successful in the past, future tail risk could leave LIP investors with a permanent loss of capital. Thus, I encourage you to think carefully before buying an LIP that might seem highly attractive based on stellar historical performance.
More generally, I offer the following suggestions for those looking at owning leveraged investments over the longer term:
Exchange-Traded Funds

Exchange-Traded Funds

Trading Strategies

H M from TX posted over 6 years ago:
MATTHEW C from UT posted over 6 years ago:
BARRY B from NH posted over 6 years ago:
MATTHEW C from UT posted over 6 years ago:
SURESH R from NJ posted over 6 years ago:
BRUCE M from CA posted over 6 years ago:
Ron C from WI posted over 6 years ago:
MATTHEW C from UT posted over 6 years ago:
LEON G from FL posted over 6 years ago:
Sneha J from IND posted over 5 years ago:
You need to log in as a registered AAII user before commenting.
Log InCreate an account