

Buffett's Cash Problem Isn't Your Problem
by Charles Rotblut | February 27, 2025
Featured Tickers: BRK.B
BRK.B
A quick note before I start. This week’s AAII Sentiment Survey reported among the lowest levels of optimism and the highest levels of pessimism in its 37-year history. There is ongoing uncertainty regarding tariffs, and more than half of all respondents to this week’s special question described the current state of the economy as mixed.
Historically, unusual sentiment levels have been contrarian signals, with the S&P 500 index outperforming during the six- and 12-month periods when bullish sentiment is very low. The relationship is not causal, but the pattern does exist. More details about this week’s survey results are shown below.
Berkshire Hathaway Inc.  (BRK.B) ended 2024 with $330.8 billion in cash and U.S. Treasury bills. This is a very large amount in aggregate terms, bigger than the market capitalization of all but 25 S&P 500 companies.
Berkshire Hathaway’s combined cash and short-term investment balance accounts for 29% of its total assets. Only 27 other S&P 500 members have a larger cash/short-term investments allocation than Berkshire Hathaway, as shown in the table. (I excluded banks and investment banking firms from the table because of the different structure of their financial statements.) Even relative to other property and casualty insurance and reinsurance companies, Berkshire Hathaway’s allocation to low volatility assets is high.
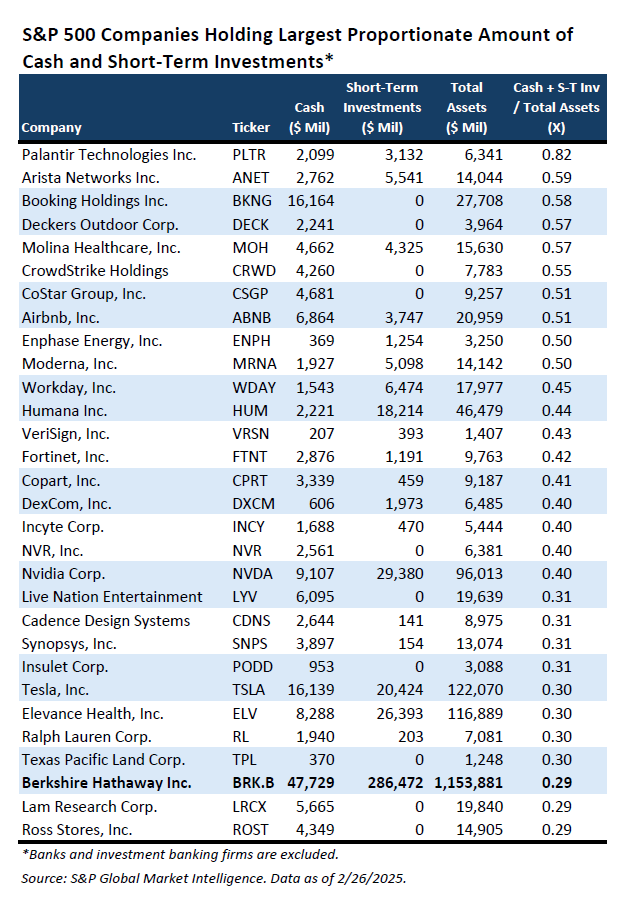
Property and casualty insurance and reinsurance companies frequently invest the premiums they receive to cover future payouts to policyholders. Berkshire Hathaway CEO Warren Buffett called this a “money-up-front, loss-payments-later” model in his latest shareholder letter. The loss-payments-later part of the model requires such companies to maintain a proportionately larger allocation to low volatility assets than is needed by individual investors with long investing time horizons.
The model has “allowed Berkshire to invest large sums (‘float’) while generally delivering what [Buffett believes] to be a small underwriting profit.” This is why Berkshire Hathaway not only owns many businesses but also owns shares of many publicly traded companies. Buffett has continually invested premiums into higher-returning stocks as well as entire businesses.
Because Buffett has had a long history of successfully allocating capital, his company’s growing balance of cash and Treasury bills is drawing much attention. Buffett responded by telling shareholders, “Despite what some commentators currently view as an extraordinary cash position at Berkshire, the great majority of your money remains in equities.”
He then added, “Paper money can see its value evaporate if fiscal folly prevails … Fixed-coupon bonds provide no protection against runaway currency. Businesses, as well as individuals with desired talents, however, will usually find a way to cope with monetary instability as long as their goods or services are desired by the country’s citizenry.”
So why so much in cash and Treasury bills? A lack of low valuations among large-cap stocks is the most probable reason. “Often, nothing looks compelling; very infrequently we find ourselves knee-deep in opportunities,” wrote Buffett.
I purposely say large-cap stocks because Berkshire Hathaway’s sheer size makes it difficult to invest in any other type of stock. Buffett continues to acknowledge this size problem: “Berkshire’s present size, it should be underscored, diminishes [the ability to sell a stock when a mistake is made]. We can’t come and go on a dime. Sometimes a year or more is required to establish or divest an investment.”
Having too much money to invest is a problem for Berkshire Hathaway—and many portfolio managers. What’s problematic for them is good for us as individual investors. We can buy and sell quickly because we are putting less money to work. Our smaller portfolios (relative to institutional investors) allow us to pivot faster and invest in areas of the markets the big investors cannot.
Never underestimate this advantage.

-
Guidelines for Selecting Bonds and Cash-Like Instruments
Key characteristics when analyzing bonds, choosing between bonds and bond funds and the role of laddering. -
The Position of the Individual Investor
The individual investor has a distinct advantage over the institution in terms of flexibility, as explained by AAII’s founder in the second issue of the AAII Journal, March–April 1979, which set the stage for AAII’s mission. -
Returns for Asset Class Groups: Big Back-to-Back Gains for Large-Cap Stocks
For the first time in nearly a quarter of a century, large-cap stocks rose by more than 20% during each of the last two years. The February 2025 AAII Journal shows a heat map of historical returns for the major asset groups.
AAII Sentiment Survey
Pessimism among individual investors about the short-term outlook for stocks increased in the latest AAII Sentiment Survey. Meanwhile, both optimism and neutral sentiment decreased.
Bullish sentiment, expectations that stock prices will rise over the next six months, decreased 9.8 percentage points to 19.4%. Bullish sentiment is unusually low and is below its historical average of 37.5% for the seventh time in nine weeks. Bullish sentiment was last lower on March 16, 2023, (19.2%) and was among the lowest 65 readings in the survey’s history.
Neutral sentiment, expectations that stock prices will stay essentially unchanged over the next six months, decreased 10.3 percentage points to 20.0%. Neutral sentiment is unusually low and is below its historical average of 31.5% for the 32nd time in 34 weeks. Neutral sentiment was last lower on September 29, 2022 (19.2%).
Bearish sentiment, expectations that stock prices will fall over the next six months, increased 20.2 percentage points to 60.6%. Bearish sentiment is unusually high and is above its historical average of 31.0% for the 13th time in 15 weeks. Bearish sentiment was last higher on September 29, 2022, (60.8%) and was the seventh-highest reading in the survey’s history.
The bull-bear spread (bullish minus bearish sentiment) decreased 30.0 percentage points to –41.2%. The bull-bear spread is below its historical average of 6.5% for the eighth time in 10 weeks.
This week’s special question asked AAII members how they would describe the current state of the economy.
Here is how they responded:
- Great: 1.4%
- Good: 36.9%
- Mixed: 54.1%
- Lousy: 6.6%
- Not sure/no opinion: 0.3%
Bullish: 19.4%, down 9.8 points
Neutral: 20.0%, down 10.3 points
Bearish: 60.6%, up 20.2 points
Bullish: 37.5%
Neutral: 31.5%
Bearish: 31.0%
See more Sentiment Survey results.

February 20, 2025 February Charts of Interest: Tariffs, Uncertainty, Eggs and More
February 13, 2025 Five Simple Steps to Make Sense of Earnings Reports
February 6, 2025 How Tariffs Could Affect U.S. Individual Investors
January 30, 2025 What Investors Should Know From Monday's AI Sell-Off

Discussion
Charles Rotblut from US-0-IL posted over 1 year ago:
Barry,
I mentioned the Sentiment Survey in this week's commentary because of today's very low bullish and very high bearish sentiment readings. Hopefully, it will earn me an attaboy. :)
-Charles
george purvis III from FL posted over 1 year ago:
Attaboy Charles! Please keep up the good work. You have always kept us on the right track. George Purvis, Naples, Florida
Charles Rotblut from IL posted over 1 year ago:
Thank you George!
Charles Rotblut from IL posted over 1 year ago:
Thank you George!
Barry J from TX posted over 1 year ago:
Charles, #1 congratulations! You earn an attaboy and a bonus attaboy (very rare) for bring our attention to (a) BRK’s balance sheet very large near-term cash position, (b) the AAII Sentiment Survey, and (c) a propitious reminder to AAIIers to be thankful for the agility they have by NOT having Buffett’s problems as a set of cockpit gauges to navigate out of the market’s hyper-kurtotic (skewedness). #2 The thing we need to learn from in the data mash-up you constructed for us is that skewed distributions (a) in market SPX valuations, (b) BRK's cash position, (c) the most recent AAII Allocation Survey data, and (d) AIIers reported “bearish "personal -- ALL are set to precede an eventual reversion to the mean. #3 This week’s reading on the AAII Sentiment Survey is “meh” on the state of the economy. #4 Last week’s “6-month market outlook” ranks the economy/inflation (46%) with 3 other causes clustered: valuations (11.6%), earnings (11.6%), and the Fed/monetary policy (11.3%); the rest is “other.” Conclusion: “It’s the economy stupid!” [Geaux Tigers!] #5 Charles, you did not relate (a) BKR hoarding cash, (b) AAII “bearish” sentiment, or (c) AAII PF allocations to (d) market volatility (variation) and (e) momentum (trends), specifically, the market drawdowns over the last two weeks in February. Ok, part of this is normal February market behavior, but this market behavior may have a link to Buffett’s cash position et al. The Buffett Indicator" compares stock market's total value to GDP (the overall size of the economy). #6 As of Thu 02/27/25, the Total Market Index is at $58,616B or about 197.2% of the last reported GDP. The Buffett Indicator warns us that buying stocks at a reading near 200% is "playing with fire." Maybe the BI helps put Buffett’s cash position into an actionable perspective. He's ready for the reversion. Are we?
You need to log in as a registered AAII user before commenting.
Create an account