


Related

ETFs and Mutual Funds
Yield-producing funds provide a steady income source, making them attractive for retirees and income-focused investors.

Yield-hungry investors have many choices among U.S. equity mutual funds and exchange-traded funds (ETFs). Understanding the characteristics and trade-offs of funds that focus on dividends, income or yield can help you choose the right investment for your portfolio.
Yield-producing funds provide a steady income source that can be reinvested for growth or used to fund portfolio withdrawals, making them attractive for retirees and income-focused investors.
Dividend-paying stocks tend to be more stable, helping to reduce overall portfolio volatility. Funds that focus on these stocks offer built-in diversification, spreading risk across multiple companies and sectors.
These funds may appreciate over time, offering a combination of capital gains and dividend income that enhances overall returns. Qualified dividends from certain equity funds may be taxed at a lower rate than ordinary income, offering potential advantages for investors seeking to limit their tax bills.
We used AAII’s Mutual Fund and ETF Screeners to identify U.S. equity income ETFs and no-load mutual funds. The mutual funds were required to be available in share classes that individual investors could purchase—including a minimum investment requirement of no more than $50,000. An average daily trading volume of greater than 5,000 shares was required for ETFs. Mutual funds and ETFs were also required to have a performance track record of at least three years.
We included mutual funds and ETFs with “dividend,” “income” and “yield” in their name. Funds focused on real estate investment trusts (REITs) and master limited partnerships (MLPs) were excluded. Distributions from REITs and MLPs are not treated as qualified dividends and are not eligible for the reduced tax rates.
We placed an emphasis on funds with higher yields: above 1.0% for mutual funds and above 2.0% for ETFs. Yield is calculated as income for the most recent 12 months divided by the month-end net asset value (NAV). For the funds that passed our filters, the average yield is 2.2% for mutual funds and 3.1% for ETFs.
The majority of the equity income mutual funds are actively managed, whereas most of the ETFs are passively managed and track an index.
Expense ratios for these mutual funds are generally higher than those of passive funds but are competitive overall. The average expense ratio for actively managed dividend-paying mutual funds is 0.86%. The two Vanguard passively managed mutual funds have an expense ratio of just 0.08%.
The average expense ratio for the passively managed equity income ETFs is 0.31%. The iShares Core Dividend ETF  (DIVB) has the lowest expense ratio at 0.05%.
The tax-cost ratio measures how much a mutual fund or ETF’s annualized return is reduced by taxes an investor in the highest tax bracket would pay on distributions. The average tax-cost ratio for this group of mutual funds is 2.1% and the average for the ETFs is 1.2%. The Gabelli Equity Income AAA fund (GABEX) has the highest tax-cost ratio of any fund listed in either table. The mutual fund’s 7.3% tax-cost ratio reduces its three-year annualized return of 5.9% to –1.4% for investors in the highest tax bracket who held it in a taxable account.
Understanding how volatile a fund is compared to its peers in the same category helps create a complete picture. The category risk index measures a fund’s volatility relative to its peers by comparing its standard deviation of returns over the past three years to that of the average for its category. A value of 1.00 represents average risk, while values above or below 1.00 indicate higher or lower risk, respectively. For example, a risk index of 1.30 means the fund is 30% more volatile than the category average.
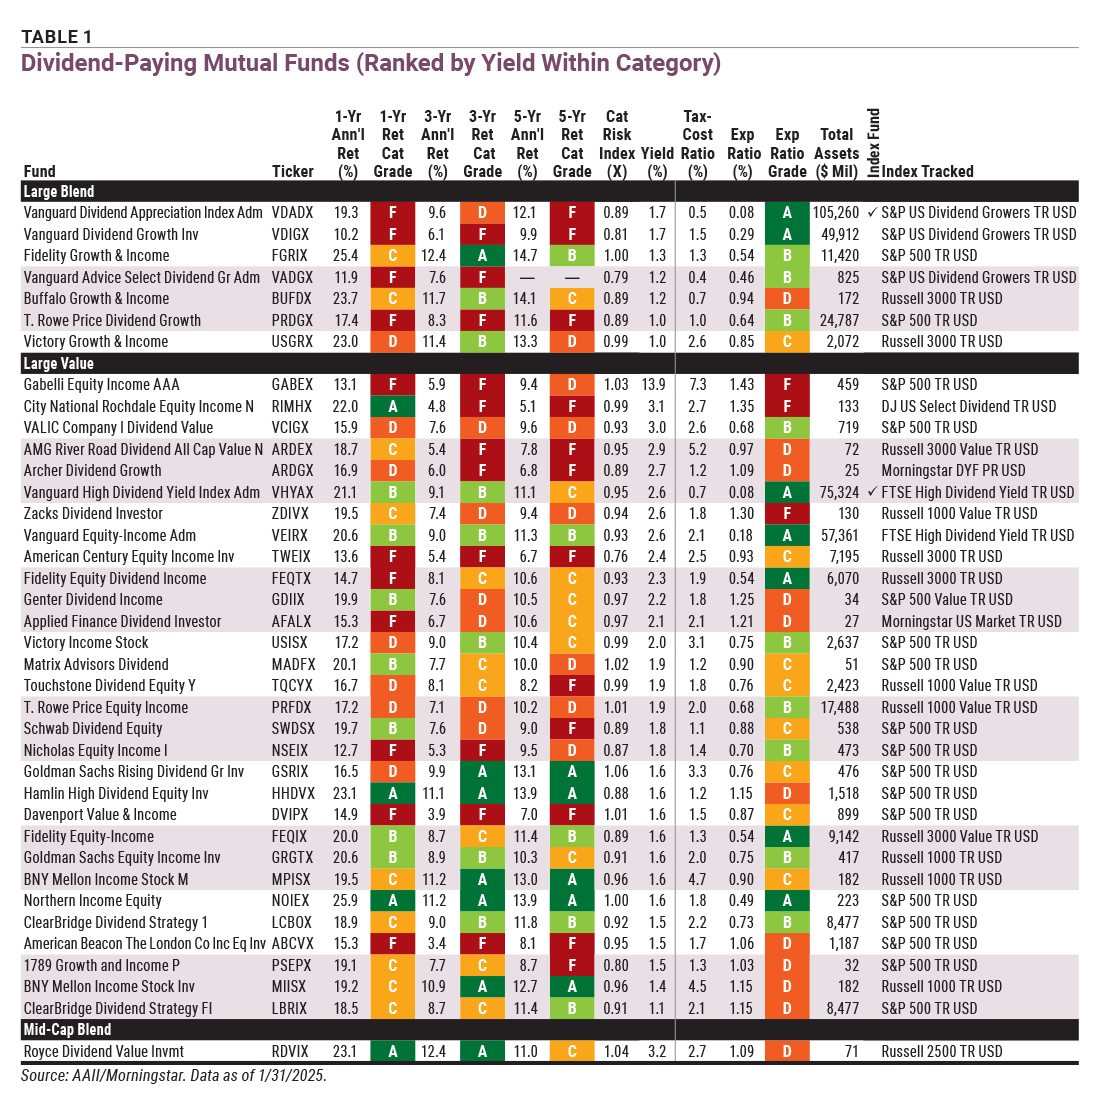
The mutual funds in Table 1 represent a variety of categories with yields ranging from 1.0% to 13.9%. Note that there is not a specific dividend or income category. We see most dividend-paying mutual funds classified in the large value category.
Download the Excel spreadsheet of Table 1.
Even within this classification, strategies vary. Many of these funds’ strategies seek income from dividends and capital appreciation in order to realize both income today and capital appreciation in the future. Some strategies are more complex and incorporate moderate amounts of fixed income or convertible securities.
Two funds that exemplify this difference in strategy are the Vanguard Dividend Growth Investor fund (VDIGX) and the Fidelity Growth & Income fund (FGRIX). The Vanguard Dividend Growth Investor primarily invests in dividend-paying stocks, focusing on high-quality companies with strong earnings growth and a commitment to increasing dividends. The Fidelity Growth & Income aims for high total return by combining current income and capital appreciation. Besides investing in dividend-paying stocks, the Fidelity Growth & Income may also invest in high-yield debt and non-dividend-paying stocks.
Although all of the funds in Table 1 are U.S. equity funds, some also allocate a small portion of their portfolio to international stocks.
The Gabelli Equity Income AAA is the highest-yielding fund of the group. Its 13.9% yield is an outlier and is more than six times the 2.2% average yield. Its yield is also 9.7 times above the 1.5% average dividend yield for its peers in the large value category. The fund focuses on income by investing at least 80% of its assets in income-producing equity securities, such as common stock, preferred stock and convertible securities, from both U.S. and international companies.
The Northern Income Equity fund (NOIEX) is one of two funds in the table with A+ Investor Grades of A for its one-year, three-year and five-year returns. This fund boasts a one-year return of 25.9%, which is the highest for all periods shown in Table 1. Its expense ratio of 0.49% is also below average for its category (grade of A). The fund has average risk for its category, while its tax-cost ratio is below average for dividend-paying funds. Income-producing equity securities, including dividend-paying common and preferred stocks, comprise this actively managed fund’s portfolio.
The passively managed Vanguard High Dividend Yield Index Admiral fund (VHYAX) seeks to track the performance of the FTSE High Dividend Yield index. This index measures the common stock investment return of companies that are characterized by a high dividend yield. True to its name, the fund has an above-average dividend yield of 2.6%. The other passively managed Vanguard mutual fund in the table, the Vanguard Dividend Appreciation Index Admiral fund (VDADX), tracks the S&P U.S. Dividend Growers index and has below-average risk for its category.
The Vanguard Advice Select Dividend Growth Admiral fund (VADGX) has significantly underperformed its large blend category peers over both the one-year and three-year periods. It was incepted in late 2021 and thus lacks a five-year track record. A quality overlay is used in addition to a dividend strategy, which may be a safeguard for selecting stocks with a likelihood of continued dividend increases. With only 26 holdings, the fund is very concentrated.
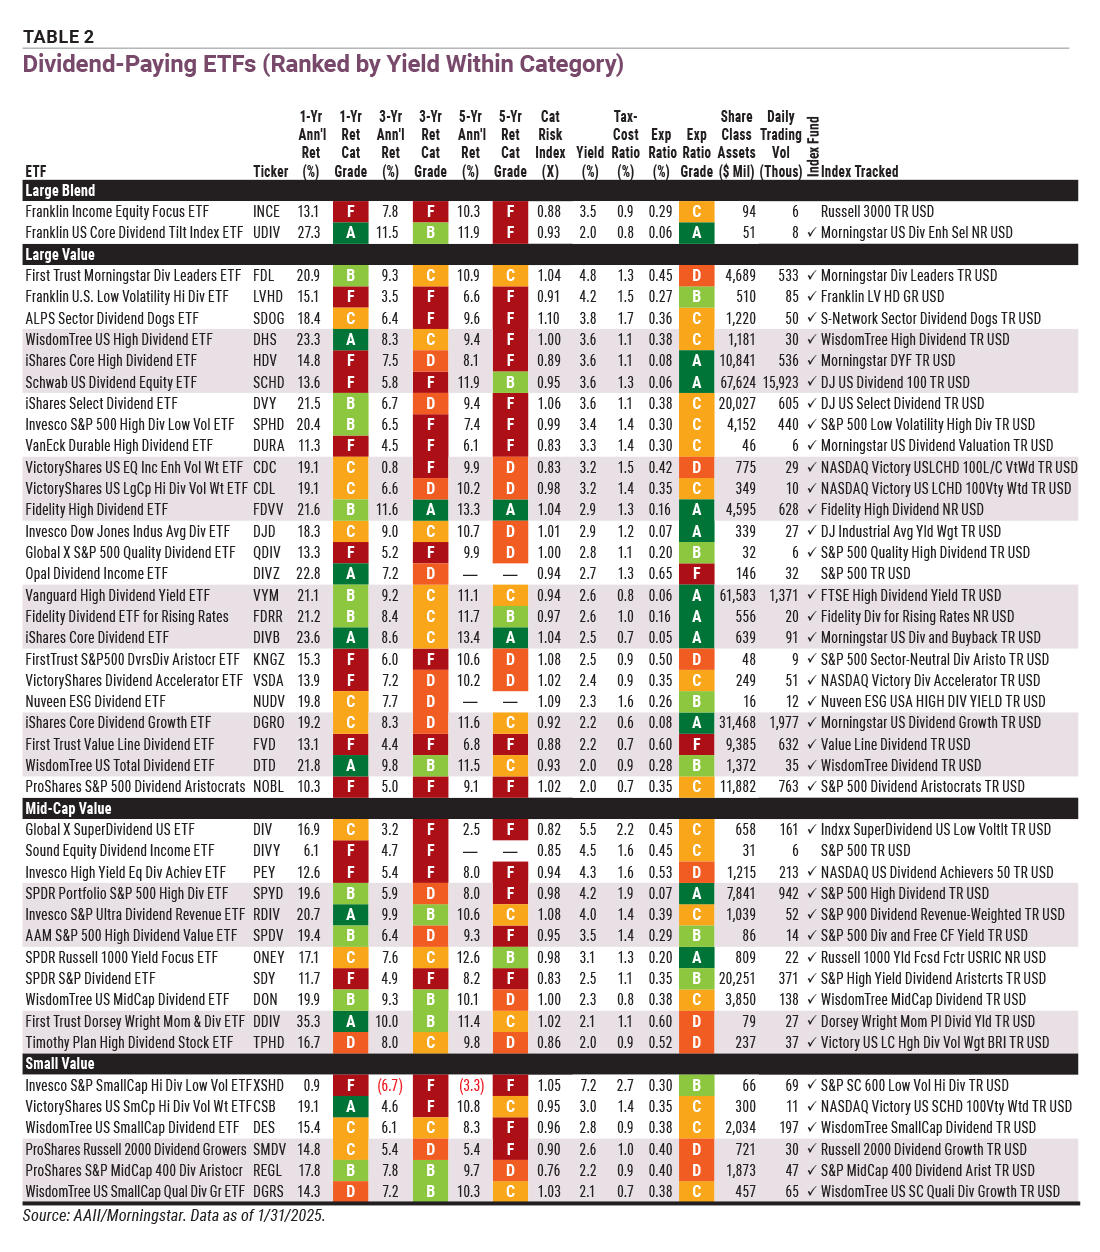
Equity income ETFs are far more diversified as a group in terms of market capitalization relative to their mutual fund counterparts. While Table 1 includes just one mid-cap mutual fund, Table 2 contains 11 mid-cap ETFs and six small-cap ETFs. Most of these ETFs are classified as value funds, similar to the mutual funds. Higher-yielding stocks tend to have lower valuation ratios.
Download the Excel spreadsheet of Table 2.
Yields for equity income ETFs range from 2.0% to 7.2%, higher than those for the mutual funds.
High yields do not always translate to high total returns. The Invesco S&P SmallCap High Dividend Low Volatility ETF (XSHD) yields 7.2% but has negative three-year and five-year annualized returns. Over the past year, the fund’s change in NAV was just 0.9%. The returns for all three periods equate to A+ Investor Grades of F. Strategies matter, and this ETF tracks an index whose holdings have historically provided high dividend yields while exhibiting lower volatility. Top holdings include REITs, which may account for the high yield and highest tax-cost ratio (2.7%) in the table.
The other small value ETFs generally provide yield through dividends generated by small-cap stocks. Most have below-average category risk, as do the mid-cap value ETFs.
An ETF that stands out for having a unique strategy is the First Trust Dorsey Wright Momentum & Dividend ETF (DDIV). As the name suggests, it combines dividends with price momentum. The ETF’s index selects high-yielding stocks from the Nasdaq US Large Mid Cap index and evaluates them based on relative strength, measured by forward price momentum against a broad market benchmark. Only securities meeting a minimum relative strength threshold are included. This First Trust ETF has a high one-year return of 35.3% but an expense ratio of 0.60%, among the highest in Table 2. The ETF’s risk is slightly above average compared to the mid-cap value category, while its yield is below the average for all ETFs in the table. The average yield for mid-cap value ETFs is 2.4%.
Overall, being actively managed didn’t seem to help performance. Of the three ETFs that don’t track an index, two have generated returns with A+ Investor Grades of F for the periods shown. The exception is the Opal Dividend Income ETF (DIVZ). This ETF outperformed its category peers for the most recent one-year annual period but realized below-average three-year annualized returns (grade of D). The ETF does not yet have a five-year track record.
Fidelity has coupled dividend payers with U.S. Treasuries. The Fidelity Dividend ETF for Rising Rates (FDRR) is designed to reflect the performance of stocks of large and mid-cap dividend-paying companies that are expected to continue to pay and grow their dividends and that have a positive correlation of returns to increasing 10-year U.S. Treasury yields. Its dividend yield is 2.6%. The ETF’s portfolio includes positions in Apple Inc. (AAPL), Nvidia Corp. (NVDA) and Microsoft Corp. (MSFT). The ETF also has below-average risk and a below-average expense ratio at 0.16% (grade of A).
The complexity of the strategy followed varies with each ETF. As you can see, visiting the ETF provider’s website will provide more information about the exact strategy followed.
Mutual funds and ETFs provide convenience and diversification, but risk and reward profiles vary with objective and methodology. Even between those with similar objectives, returns are inconsistent. Along with yield, historical returns, category risk and tax-cost ratio, portfolio composition is important to examine.
Understanding if the fund is trying to take advantage of dividend growth versus dividend income is a first step. Knowing how the additional objectives such as low volatility or momentum work and how strategies will perform under different market conditions are next steps. Looking at the cadence of distributions and rebalancing schedules can provide insight into the tax impact.
ETFs and Mutual Funds

ETFs and Mutual Funds

ETFs and Mutual Funds

ROBERT A from NC posted over 1 year ago:
JOHN W from NC posted over 1 year ago:
GARETH D from MN posted over 1 year ago:
DUNCAN H from WA posted over 1 year ago:
JOHN W from NC posted over 1 year ago:
BARRY J from TX posted over 1 year ago:
D. R from MD posted 7 months ago:
You need to log in as a registered AAII user before commenting.
Log InCreate an account