

History Shows Investors Benefit From Staying Put During Crises
by Charles Rotblut | March 05, 2026
Special Note: My Portfolio will fully transition to the brand new AAII Investor Hub on March 15. The legacy My Portfolio interface will no longer be available at that point. This change is being made so we can add new features to the AAII Investor Hub, including broker integration with the fully rebuilt My Portfolio. All of your portfolios, your saved stock screens and your saved articles are currently on the Hub. We encourage you to start using the AAII Investor Hub today.
The strikes against Iran have led to a jump in oil prices and stock market volatility. There are big known unknowns that traders are attempting to price in. What we do know is that sticking with your portfolio allocation during periods of crisis has historically been the right move.
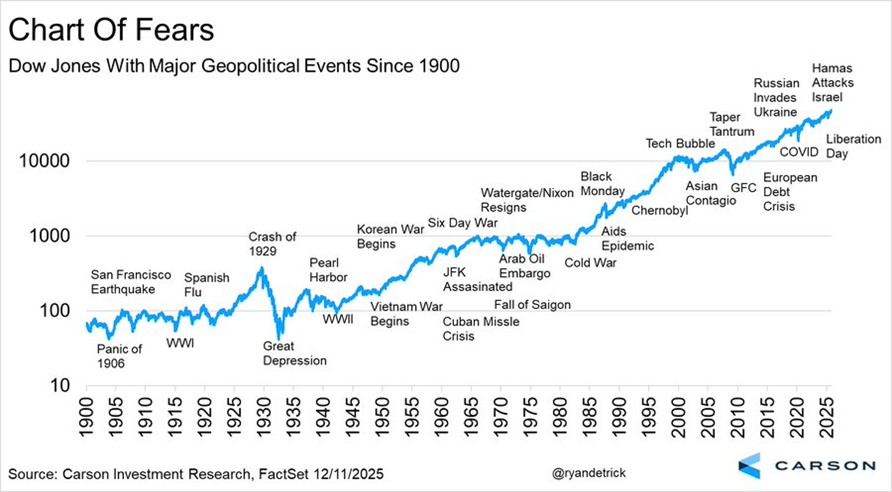
The stock market’s typical pattern following the start of a geopolitical event or other crisis has been to have an initial reaction and then move past it. The chart below from Ryan Detrick, CMT, at Carson Group shows how the Dow Jones industrial average has performed following major geopolitical events dating back to 1900. I chose this chart because it is updated through 2025.
For those of you who prefer more detail, I include a table at the end of this article that I originally shared at the start of Russia’s invasion of Ukraine in 2022. It was put together by Calamos Wealth Management’s Investment Strategy Group and shows the stock market’s response to geopolitical conflicts dating back to World War II. The average total drop (aka drawdown) in the S&P 500 index from an event date to market bottom was 4.8%.
Averages are influenced by the upper and lower ends of the data. The S&P 500 plunged 19.8% following the 1941 attack on Pearl Harbor. It barely budged after Iranian general Qasem Soleimani was killed in 2020. The S&P 500’s 0.7% decline that day was within the realm of typical daily volatility.
While the day’s events always drive the headlines we see and the news we hear, patient investors know to think longer term. This behavior is to their benefit. After periods of six months or longer, factors beyond the immediate start or escalation of conflict have historically influenced the market’s direction.
Just as was the case when Russia invaded Ukraine, there are several known unknowns now. Iran has responded by attacking several countries. It is also in the process of naming a new leader. Shipments of oil through the Strait of Hormuz have dropped over 80%, according to The Wall Street Journal. How long the current military campaign will last and what comes after it are big question marks. Ideally, the Iranian government will be willing to compromise on its weapons, stop supporting terrorist groups and treat its own citizens better. (To paraphrase John Lennon, call me a dreamer, but I’m not the only one.)
Economically, the conflict’s impact goes beyond oil and natural gas. Cargo ships are reportedly rerouting to avoid Middle Eastern passageways like the Suez Canal. This extends transit times.
Many other factors could influence the direction of the global equity, fixed-income and commodity markets. The U.S. will soon be getting a new Federal Reserve chairman. We still lack certainty about tariffs. The European Union (EU) is both looking at new trade pacts and strengthening its military capabilities. Questions about artificial intelligence (AI) abound, both in terms of its broad impact and the level of investment in it. Other military conflicts could break out.
As investors, we don’t get to choose the financial market conditions we live through, much less the geopolitical conditions. Systematic risk—that is, the risk of doing anything with your money—never goes away. But the bigger risk to most investors’ portfolios is behavioral: making big portfolio decisions based on short-term events instead of staying focused on achieving longer-term financial goals.
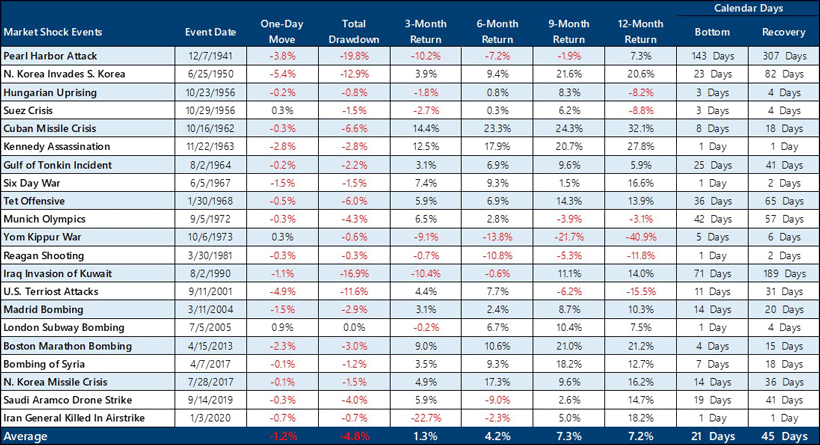
Source: LPL Research, S&P Dow Jones Indices, CFRA, Bloomberg. Past performance doesn’t guarantee future results. The illustrated returns are reflective of the performance under the stated timeframe for the S&P 500 Index and beginning with the “event date”. The S&P 500 index is a stock market index that tracks performance of 500 U.S.-based large-cap companies from various sectors. It is widely considered a gauge of investor sentiment and its returns reflect the state of the American economy.

-
12 Hidden Lessons From Investment History
Investors who are willing to learn from nearly a century of data can discover some important takeaways. -
What Market Volatility Really Is and How to Navigate It
Volatility refers to the magnitude of movement instead of a single direction; AAII founder James Cloonan encouraged investors to focus on “real risk.” -
Cash Is King and Free Cash Flow Wears the Crown
The just released March 2026 AAII Journal explains why free cash flow is not just an accounting exercise but is central to valuation.
AAII Sentiment Survey
Neutral sentiment among individual investors about the short-term outlook for stocks increased in the latest AAII Sentiment Survey. Meanwhile, optimism and pessimism decreased.
Bullish sentiment, expectations that stock prices will rise over the next six months, decreased 0.1 percentage points to 33.1%. Bullish sentiment is below its historical average of 37.5% for the third time in 14 weeks.
Neutral sentiment, expectations that stock prices will stay essentially unchanged over the next six months, increased 4.4 percentage points to 31.4%. Neutral sentiment is below its historical average of 31.5% for the 85th time in 87 weeks.
Bearish sentiment, expectations that stock prices will fall over the next six months, decreased 4.2 percentage points to 35.5%. Bearish sentiment is above its historical average of 31.0% for the fourth consecutive week.
The bull-bear spread (bullish minus bearish sentiment) increased 4.1 percentage points to –2.5%. The bull-bear spread is below its historical average of 6.5% for the fourth consecutive week.
This week’s special question asked AAII members what their perception of inflation is.
Here is how they responded:
- It’s slowing, but not by enough: 38.6%
- It’s returning to a more acceptable pace: 33.2%
- It’s still rising too quickly: 22.4%
- Not sure/no opinion: 5.4%
Bullish: 33.1%, down 0.1 points
Neutral: 31.4%, up 4.4 points
Bearish: 35.5%, down 4.2 points
Bullish: 37.5%
Neutral: 31.5%
Bearish: 31.0%
See more Sentiment Survey results.

AAII Asset Allocation Survey
Individual investors’ allocations to bonds increased while stock and cash allocations decreased in the February AAII Asset Allocation Survey.
Stock and stock fund allocations decreased 0.8 percentage points to 69.4%. Stock and stock fund allocations are above their historical average of 61.5% for the 69th consecutive month.
Bond and bond fund allocations increased 1.0 percentage points to 16.4%. Bond and bond fund allocations are above their historical average of 16.0% for the first time in five months.
Cash allocations decreased 0.2 percentage points to 14.2%. Cash allocations are below their historical average of 22.5% for the 39th consecutive month.
- Stocks and Stock Funds: 69.4%, down 0.8 percentage points
- Bonds and Bond Funds: 16.4%, up 1.0 percentage points
- Cash: 14.2%, down 0.2 percentage points
- Stocks: 30.7%, up 1.6 percentage points
- Stocks Funds: 38.7%, down 2.4 percentage points
- Bonds: 5.2%, up 0.6 percentage points
- Bond Funds: 11.2%, up 0.4 percentage points
- Stocks/Stock Funds: 62.0%
- Bonds/Bond Funds: 16.0%
- Cash: 22.0%
Take the Asset Allocation Survey.
February 26, 2026 Five Sources for Assessing Tariff Impact on Your Portfolio
February 19, 2026 February Charts of Interest: Is Too Much Being Spent on AI?
February 12, 2026 The Categories and ETFs With the Highest 10-Year Returns
February 5, 2026 PEG Ratios Are Often Based on Just a Single Forecast

Discussion
Barry from TX posted 7 months ago:
Charles, thank you for reprising these data (from such reputable sources) to remind us of the ephemeral nature of cross-country conflicts on US markets (in these examples here using SPX). I think the AAII audience has been inculcated through Investing at Level 3, AAII educational offerings, and Community member testimonials to stay invested. I believe that the usual suspect external forces (fill in your favorite media names here) are the ones crying “wolf” because, unlike disciplined AAII investors, THEY (not us) MAKE MONEY using a “hurt and rescue” psychology to pickoff a few of the Little Piggies in “straw portfolios.” For reference, “hurt and rescue" is a manipulative, often narcissistic tactic where someone calculates how a crisis increases emotional distress (emotional, physical, or situational), and then poses as the hero who will "fix" it. This creates intense trauma bonding and dependency, as the victim becomes hooked on the relief provided by the perpetrator. AAII helped me diversify my “brick portfolio,” asset class by asset class over time, probably still a “piggie” capitalist, not drawdown proof, but a better-educated "piggie" investor, thanks to the AAII team.
DENNIS from CA posted 7 months ago:
As a life member since the 80s, all I can say is: What an absolutely horrible piece. I'm flabbergasted.
Barry from TX posted 7 months ago:
#1 Carson's "Chart of Fears" traces DJIA returns from 1900 to 2025 on a log scale. #2 Did anyone notice that the SLOPE (rate of change) of the line GROWS from UNDER 100 to OVER 10,000 in the 100 years (the 20th Century) from 1900 to 2000, and continues to grow from 2000 to 2025? This "beneficial outcome" is the result of simple YOY mathematical compounding that is available to everyone who stays invested and does not interrupt a CAGR at work.
Barry from TX posted 7 months ago:
I think I have found a positive, constructive use for market volatility. #1 When the market (SPX) goes down after a daily session, I compare (a) the percent SPX went up/down to (b) the percent my portfolio went up/down. This gives me inferred "nominal" feedback on how well I have diversified my portfolio. #2 If my losses are lower than SPX losses'gains, I can use the difference to infer that my portfolio is better diversified than the market. #3 In his 1964 CAPM paper, William Sharpe's mathematical proof that the total market volatility (which he named "beta") always = 1 (that's one reason it's a useful benchmark) since the total market has perfect diversification by MPT definitions. Sharpe named returns above the overall market beta "alpha." #4 I hypothesize that I can use Sharpe's tautologies to compare the relative diversification of any portfolio, ETFs, and mutual funds to the benchmark total market. #5 It's called this tracking error. Portfolio managers use "beta" as a benchmark to evaluate their managerial performance. #6 I hypothesize that you can also use this logic to evaluate how well the portfolio your FA built for you is serving your interests ...or not. Fun is where you find it. Comments?
Barry from TX posted 6 months ago:
Since Charles published his COI article 11 days ago, I have seen 3 other versions of these data. All are derivatives of the graph and table Charles provided by Carson, but the one that expanded my learning was a "quilt chart" table showing YOY annual performance by the 9 Morningstar Size-Style SPX sectors + 4 Ex-US Size-Style sectors (to compare international diversification to US performance). These articles used these data to demonstrate (1) how market sector performance changes YOY, (2) how we can use these random fluctuations to "stay invested" long term, and (3) how a truly diversified portfolio provides the best strategy to maximize returns. Yet another example of what staying invested for the long run is the most prudent strategy. As James Cloonan advised in his second AAII article ("The Position of the Individual Investor" 1979), the only "real risk is behavioral" - getting out of the market reduces the long-term benefits markets provide.
gary from pa posted 6 months ago:
seems like the most relevant would be the arab oil embargo of the 1970's but it didn't make the list.
You need to log in as a registered AAII user before commenting.
Create an account