

Eight $1 Billion-Plus ETFs With Above-Average Expense Ratios
by Charles Rotblut | April 30, 2026
Featured Tickers: AKRE
DFMC
DFSCX
DUSA
EQTY
OAKM
AKRE
DFMC
DFSCX
DUSA
EQTY
OAKM
Part of the appeal of exchange-traded funds (ETFs) is their low expense ratios. As a group, ETFs are inexpensive to own. But not all ETFs are inexpensive. Some are costly, including those that are widely held.
I made the broader point about not assuming that all ETFs are cheap at last week’s BetterInvesting National Convention. Afterward, it occurred to me that having examples in my presentation would have better emphasized the point. It is always challenging to know exactly how much information can be put into a slide deck without going over the time limit.
So, when I got home, I used AAII’s ETF Screener to identify large-cap ETFs with at least $1 billion in assets under management (AUM) that had high expense ratios. I found eight ETFs whose expense ratios rank in the top 20% of their respective categories and have been in existence for at least one year.
The average expense ratio for these eight ETFs was 0.75%. To put this into perspective, the average expense ratios for the large blend, large growth and large value categories are 0.43%, 0.50% and 0.37%, respectively. It is easy to find ETFs with expense ratios of 0.10% or lower in these categories.
Here are those eight costly ETFs.
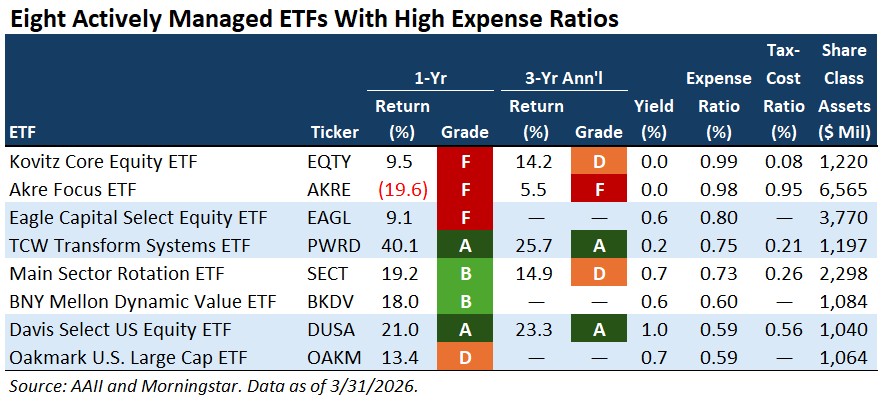
Taxes add to the cost of ownership. Akre Focus ETF  (AKRE) has a tax-cost ratio of 0.95%. Davis Select US Equity ETF (DUSA) has a tax-cost ratio of 0.56%. These numbers imply that an investor in the highest tax bracket saw their returns reduced by 0.95% and 0.56% by taxes owed on the distributions. (The tax-cost ratio assumes that the ETF is held in an individual taxable account.)
Active Management Is a Common Thread
The continuing growth of active fund management within the ETF industry is a common thread connecting these eight ETFs.
Two of the ETFs, Akre Focus and Kovitz Core Equity ETF (EQTY), formerly existed as actively managed ETFs. Davis Select US Equity and Oakmark U.S. Large Cap ETF (OAKM) make use of the approaches followed by their respective issuers’ mutual funds. In all four cases, the higher expenses can be attributed at least in part to the fund sponsors’ backgrounds in running actively managed mutual funds.
This is part of a broader trend. Sponsors of actively managed mutual funds have been moving into the ETF space. We are about to see many more. Last month, Dimensional Fund Advisors launched DFA US Micro Cap ETF (DFMC), a share class of DFA U.S. Micro Cap I fund (DFSCX). While Dimensional Fund Advisors’ funds are lower cost, I expect many of the forthcoming ETF share classes of actively managed mutual funds to have high expense ratios for their respective ETF categories.
The importance of low expense ratios is a drum that we at AAII constantly beat. The less you spend on fund expenses, the more money you have to save and invest. This is a point I emphasized while speaking at the BetterInvesting National Convention.
More expensive large-cap ETFs exist. What separates these eight is that they are widely held, with each having more than $1 billion in AUM. Investors are buying them without considering the cost of ownership—something we encourage you to never do.

-
Active Strategies That Have Fared Well Among Mutual Funds and ETFs
When evaluating active strategies, consider manager tenure, differentiated strategies and segments with less competition for active managers. -
The Great Migration: What’s Behind ETF Asset Growth
A growing number of asset managers are converting traditional mutual funds into ETFs or preparing to offer ETFs as a mutual fund share class. -
Using New Highs and New Lows to Measure Market Breadth
The new highs/new lows indicator provides a simple yet powerful window into the market’s internal health, as illustrated in the April 2026 AAII Journal.
AAII Sentiment Survey
Optimism among individual investors about the short-term outlook for stocks decreased in the latest AAII Sentiment Survey. Meanwhile, neutral sentiment and pessimism increased.
Bullish sentiment, expectations that stock prices will rise over the next six months, decreased 7.9 percentage points to 38.1%. Bullish sentiment is above its historical average of 37.5% for the second time in 11 weeks.
Neutral sentiment, expectations that stock prices will stay essentially unchanged over the next six months, increased 2.6 percentage points to 22.2%. Neutral sentiment is unusually low and is below its historical average of 31.5% for the 93rd time in 95 weeks.
Bearish sentiment, expectations that stock prices will fall over the next six months, increased 5.3 percentage points to 39.7%. Bearish sentiment is above its historical average of 31.0% for the 12th consecutive week.
The bull-bear spread (bullish minus bearish sentiment) decreased 13.2 percentage points to –1.6%. The bull-bear spread is below its historical average of 6.5% for the 11th time in 12 weeks.
This week’s special question asked AAII members how they would describe the current valuation of stocks.
Here is how they responded:
- Stocks, in general, are overvalued: 44.1%
- Stocks, in general, are fairly valued: 16.2%
- Valuations are mixed, with some stocks expensive and others cheap: 34.9%
- Stocks, in general, are undervalued: 1.8%
- Not sure/no opinion: 3.1%
Bullish: 38.1%, down 7.9 points
Neutral: 22.2%, up 2.6 points
Bearish: 39.7%, up 5.3 points
Bullish: 37.5%
Neutral: 31.5%
Bearish: 31.0%
See more Sentiment Survey results.

April 23, 2026 Stocks Gone Wild and Other April Charts of Interest
April 16, 2026 Wide Valuation Dispersion Creates Stock-Picking Opportunities
April 9, 2026 What's Driving 2026 Stock Market Rotation by Size and Sector
April 2, 2026 The Outsized Influence of AGI on Your Tax Return

Discussion
Ryan from Colorado posted 5 months ago:
While PWRD and DUSA do have higher ratios, both also have an 'A' in the 1 and 3 year return, which could help explain why they have more AUM. While some that have a lower expense ratio could have a lower 1 and 3 year grades (such as B or C). I noticed that while looking for a Large Cap Value and Small Cap Blend ETFs. So I decided to go with a slightly higher expense ratio for better long term results, thinking that the higher price could be worth it.
Barry from TX posted 5 months ago:
Why do you refer to low ER ETFs as “cheap” (instead of “well-managed” or “more efficient”) when you do not refer to the ETFs listed here as “expensive” -- which they are? The question to ask is: Why does it cost so much MORE (roughly a 10:1 difference) for only 2 of the 8 to implement a strategy that produces grade “A” returns? #1 The difference is that these EXPENSIVE ETFs “shop for” a “haute couture“ custom benchmark that allows them considerable leeway with the strategy listed in the prospectus to achieve their tracking error (the primary industry measure of performance to benchmark for ETFs and for manager compensation) …. AND …. (wait for it) they produce more money for the firm and for the fund managers. #2 Paying higher fees reduces total return now and long term. Period. #3 The AAI returns grades listed here say you have a 1 in 4 (25% probability) of getting better returns than an ETF that has a total ER of less than 0.10% (some offer 0.05% and one that has 0% ER). #4 Pay yourself first. That over 1% “vig” to the fund manager drags your long-term TOTAL return down by 20% to 30% when you need it. #5 That’s why I call them EXPENSIVE. They are too expensive for my palate.
You need to log in as a registered AAII user before commenting.
Create an account