

May Charts of Interest: What's Driving This Spring's Rally
by Charles Rotblut | May 21, 2026
Featured Tickers: GOOGL
IVV
NVDA
XSD
GOOGL
IVV
NVDA
XSD
This spring’s jump in the stock market has been strong. In this month’s charts of interest, we look at the two drivers behind the strength: corporate earnings and semiconductor stocks. We then switch to inflation before ending with a look at the tightening competitive race in artificial intelligence (AI).
As a reminder, the monthly charts of interest highlights charts and tables I’ve come across that have not made their way into other AAII commentaries.
First-Quarter 2026 Earnings Have Been Good
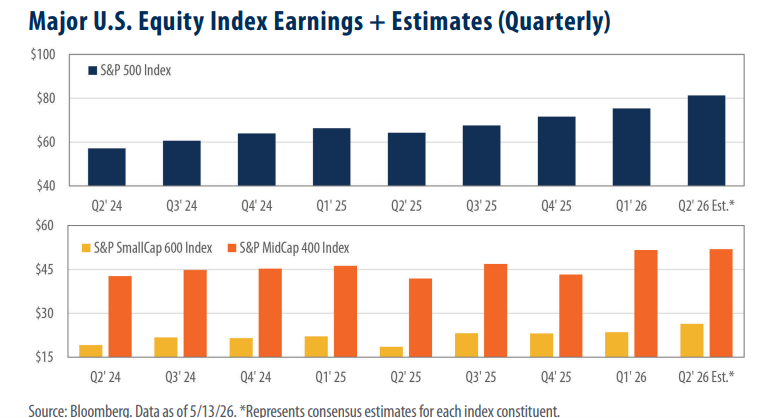
Earnings have been a driver of this spring’s market rally. Corporations are reporting profit growth, and analysts have been upwardly revising their second-quarter and full-year 2026 earnings forecasts. First Trust Portfolios’ Robert Carey and Peter Leonteos shared this takeaway: “The S&P 500 index’s trailing 12-month price return of 30.6% [through May 8, 2026] nearly matches its [first-quarter 2026] year-over-year earnings growth rate of 27.7% as of the same date.”
The energy sector has influenced the upwardly revised full-year 2026 earnings estimates for the S&P 500, but it is not the only one. Analysts have also become more optimistic about the outlook for information technology and communication services companies. On the other hand, earnings growth expectations have fallen for the healthcare sector, per LSEG I/B/E/S.
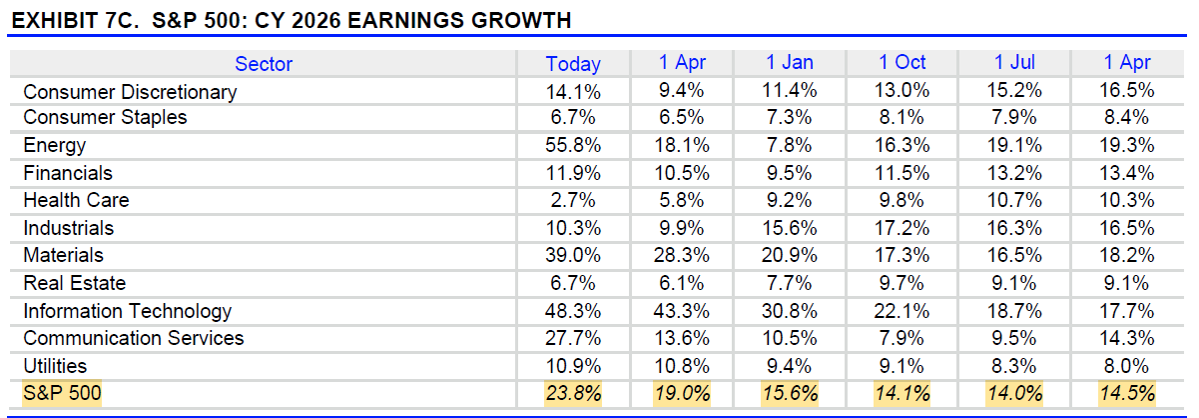
Source: LSEG I/B/E/S. Data as of 5/15/2026.
Talk About Pushing Your Chips In
Nvidia Corp.’s  (NVDA) run toward a $6 trillion market capitalization has played a role in helping the S&P 500 reach new highs, but it is not alone. Many other semiconductor stocks have also computed big gains lately. I plotted State Street SPDR S&P Semiconductor ETF (XSD) against iShares Core S&P 500 ETF (IVV). The semiconductor ETF tracks a modified equal-weighted index, which keeps Nvidia from having outsized influence on its performance. It is up significantly since the end of March.
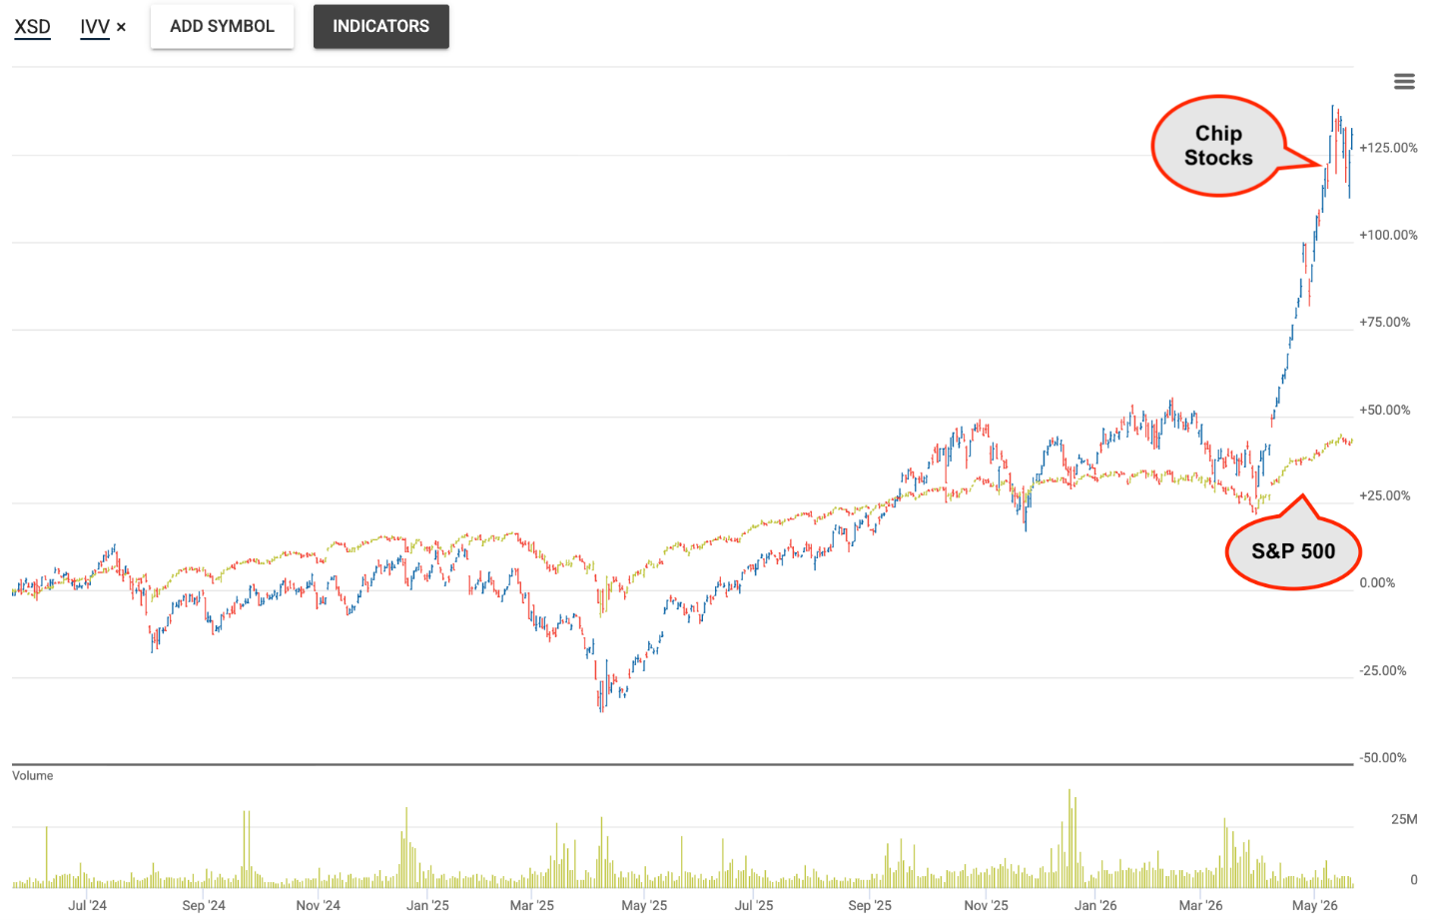
Source: AAII.com. Data from QuoteMedia as of 5/20/2026.
Inflation Expectations Are Rising
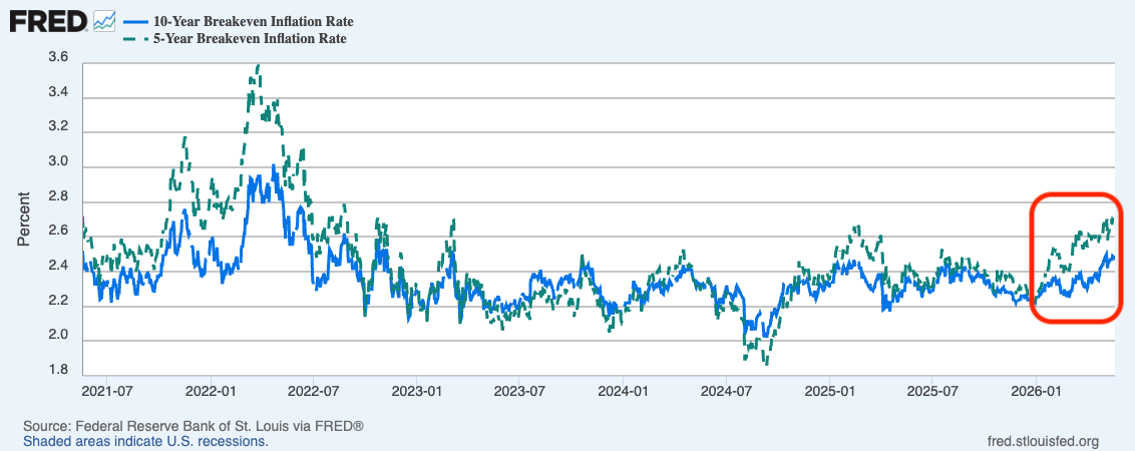
Incoming Federal Reserve chairman Kevin Warsh is not walking into an ideal inflation environment. On Tuesday, May 19, the five-year breakeven inflation rate was 2.66% —its highest level in three years. The 10-year breakeven rate is also rising. Both reflect the inflation expectations that traders are pricing into bonds. Blame the ongoing oil shock caused by the closing of the Strait of Hormuz.
Will There Be an Interest Rate Hike Later This Year?
Given what’s happening in the bond market, at the gas pump and even with tomato prices (up 39% over the last year!), I revisited the CME FedWatch Tool. Traders are currently pricing in an approximately 60% chance of interest rates being raised by the end of this year. These odds could change significantly based on what does and does not happen with the Iran war.
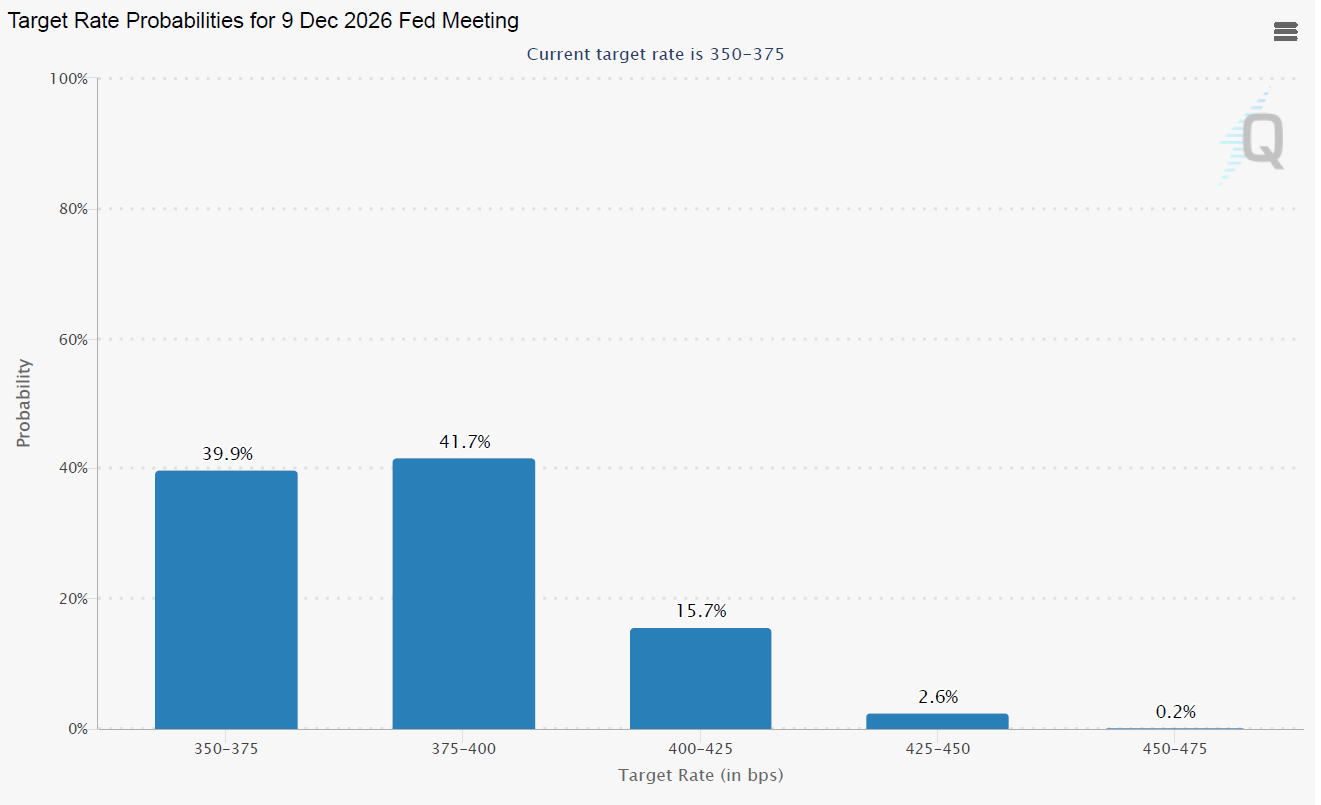
Source: CME Group.
Traditional Business Forces Apply to AI Too
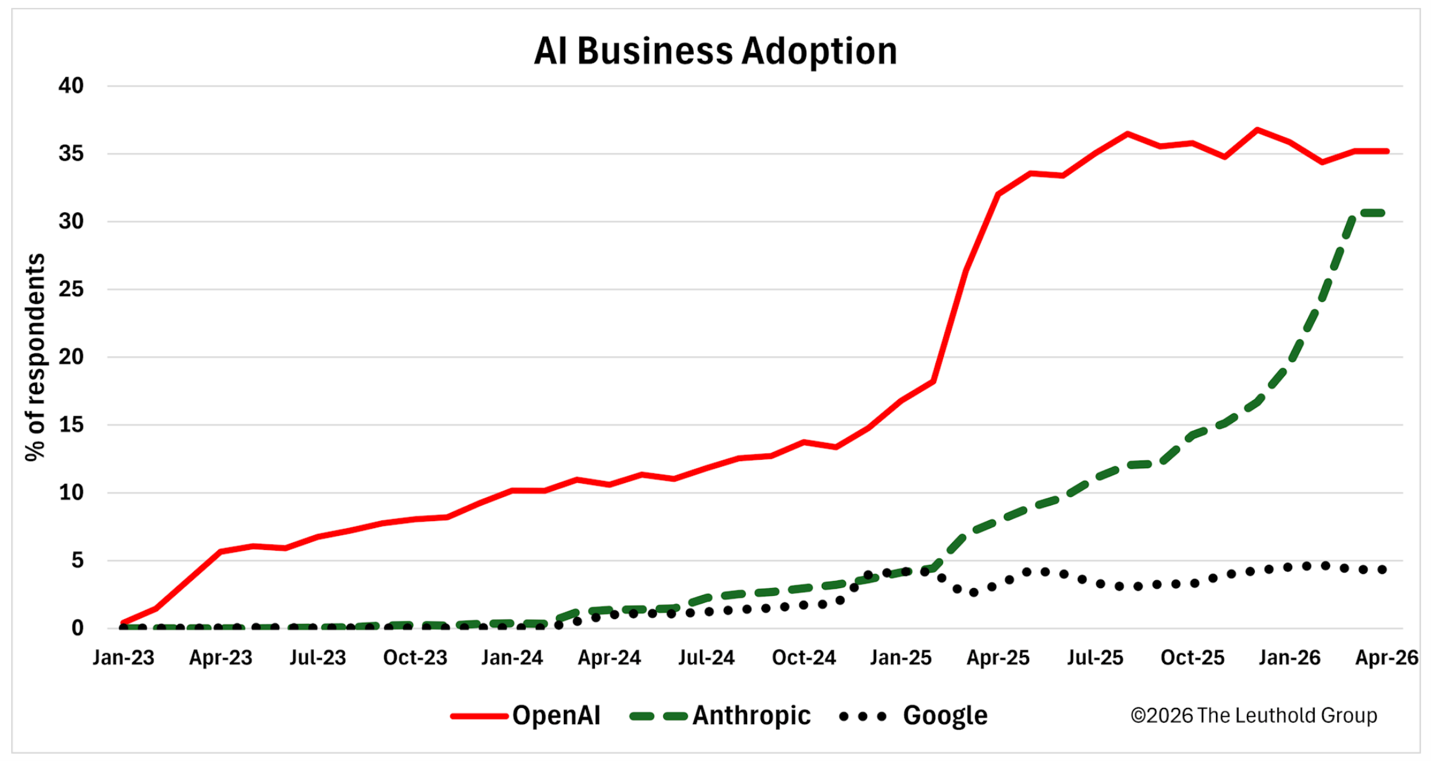
OpenAI, the company behind ChatGPT, is preparing to file for an initial public offering (IPO) “in the coming days or weeks,” according to The Wall Street Journal. The company will be questioned about whether it can maintain its current market share as it makes pitches to potential investors. Competitor Anthropic (the company behind Claude) has been gaining market share. Alphabet Inc.’s (GOOGL) Google Gemini has made inroads too.
The chart below from The Leuthold Group is a reminder that the still-young AI market is not immune from the traditional business forces of competition. The early entrants in technological innovation aren’t always the long-term winners.

-
How to Analyze Corporate Earnings in Five Steps
Earnings reports provide a snapshot of business performance, but they are most valuable when viewed as part of a longer-term trend. -
Incorporating Equal-Weighted Funds Into Your Allocation
Equal-weighted funds hold the same securities as similar market-cap-weighted funds but in different proportions, reducing stock-specific risk. -
Navigating the Rise of Prediction Markets
Participating in prediction markets should be regarded as speculative due to their binary outcomes, novel nature, evolving regulation, relatively high costs and low liquidity, as discussed in the May 2026 AAII Journal.
AAII Sentiment Survey
Optimism among individual investors about the short-term outlook for stocks decreased in the latest AAII Sentiment Survey. Meanwhile, neutral sentiment and pessimism increased.
Bullish sentiment, expectations that stock prices will rise over the next six months, decreased 7.6 percentage points to 31.7%. Bullish sentiment is below its historical average of 37.5% for the first time in five weeks.
Neutral sentiment, expectations that stock prices will stay essentially unchanged over the next six months, increased 0.6 percentage points to 24.7%. Neutral sentiment is below its historical average of 31.5% for the 96th time in 98 weeks.
Bearish sentiment, expectations that stock prices will fall over the next six months, increased 7.0 percentage points to 43.6%. Bearish sentiment is unusually high and is above its historical average of 31.0% for the 15th consecutive week.
The bull-bear spread (bullish minus bearish sentiment) decreased 14.6 percentage points to –11.9%. The bull-bear spread is unusually low and is below its historical average of 6.5% for the 14th time in 15 weeks.
This week’s special question asked AAII members how they would describe the earnings guidance given by companies during first-quarter 2026 earnings season.
Here is how they responded:
- Better than I expected: 51.9%
- Approximately what I expected: 27.6%
- Worse than I expected: 2.8%
- Not sure/no opinion: 17.7%
Bullish: 31.7%, down 7.6 points
Neutral: 24.7%, up 0.6 points
Bearish: 43.6%, up 7.0 points
Bullish: 37.5%
Neutral: 31.5%
Bearish: 31.0%
See more Sentiment Survey results.

May 14, 2026 Are AI-Related Stocks in a Bubble?
May 7, 2026 Ways to Redeploy Cash After a Big Gain
April 30, 2026 Eight $1 Billion-Plus ETFs With Above-Average Expense Ratios
April 23, 2026 Stocks Gone Wild and Other April Charts of Interest

Discussion
Barry from TX posted 4 months ago:
Charles, I see this COI edition as a Maypole. That’s a good analogy for how these data are entangling us in minutiae when we should be “unravelling” the distracting collage and focus on unwinding these entangled data streams to address the risks threatening the security of our investments.
Barry from TX posted 4 months ago:
Charles, when I parse these data, all I see are HIGH PROBABILITIES for REVERSION TO THE MEAN IN ALL THESE OUTLIERS. (1) First Trust 1Q25 EPS up "revs" are based on lofty and hopeful FORWARD PROJECTIONS based solely on estimates. p(RTM) = HIGH. (2) LSEG data shows XSD (semiconductor ETF) priced at 5x valuation. The SC industry is notorious for cyclical price swings. p(RTM) = VERY HIGH. (3) Bond prices are highly sensitive to futures contracts SPECULATION. That's the nature of this beast. p(RTM) = VERY HIGH. (4) STL Fed CME p(FFR) by EOY is tethered to prediction market amateurs' "guesses" on a very wide set of uncertain war outcomes. Bayesian math says p(RTM) = HIGH. (5) Look at the Leuthold Group chart of OpenAI's HISTORY. It captures two key points (A) the SPIKE @12 after Chatbot 5.0's release in 11/24 and (B) OpenAI's PLATEAUING beginning @ 3x (35) in 07/26. The OpenAI roller coaster is perched at its apogee and is poised for gravity to do the Newton thing. p(RTM) = VERY HIGH. These data points are ALL coin flips in a Bernoulli sequence where the result of the next flips each have a 50% probability of LOSING ALL prior accumulations. "We are cursed to live interesting times." In today's times, return to the mean is not your friend.
You need to log in as a registered AAII user before commenting.
Create an account