

My Personal Portfolio Four Months After Correction
by Charles Rotblut | April 25, 2019
Special note: To celebrate the 40th anniversary of the AAII Journal, we’ve put together a collection of timeless and valuable articles from the archives using input from staff and members. A new Top 40 article is revealed each weekday. To see the growing list, visit the Top 40 archive here.
Long-term readers know by now that I only check my 403(b) account, which is similar to a 401(k) account, just twice a year. I take a look at the end of April and the end of October. The best six months for the stock market run from November through April (when returns tend to be higher). The worst six months run from May through October (when returns tend to be lower but are still positive on average). I use both dates as cues to see if my portfolio needs to be rebalanced.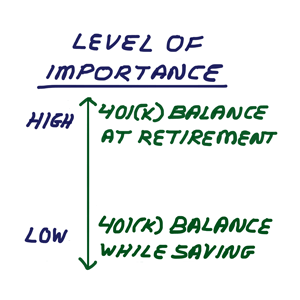
I looked at my account for the first time since last October. No rebalancing was required. Of the five mutual funds I own, the Vanguard S&P 500 Index fund (VFIAX) accounted for the largest position of my portfolio at 22.8%. The Vanguard Intermediate-Term Investment-Grade fund (VFIDX) was the smallest position at 17.9%. If either had accounted for more than 25% or less than 15%, I would have rebalanced the portfolio back to 20% per fund. The position size of the other three funds: Vanguard FTSE All-World ex-US Small-Cap Index fund (VFSVX), Vanguard REIT Index fund (VGSLX) and Vanguard Small-Cap Value Index fund (VSIAX) were in the middle at 19.2%, 19.4% and 20.8% of the total portfolio, respectively. (These numbers are prior to my April monthly contribution being deposited into the account. The monthly contributions are allocated evenly to each of the five funds.)
What were the allocations on December 24, 2018, when the S&P 500 index was more than 24% below its current level? I don’t know because I didn’t look at the account. By purposely not paying attention to the balance, I avoid seeing the highs and—more importantly—the lows. It’s akin to being a moviegoer and avoiding horror flicks; such a person will never get scared at the theater. Plus, the current balance is meaningless. What truly matters is having a process in place to save and invest in a disciplined manner that will lead to having a significantly larger account balance at retirement.
While I strongly believe being disciplined is critical to investment success, I also believe that investing is messy and allowing for some flexibility is warranted. In mid-to-late December, I took the tactical step of accelerating the timing of planned contributions to my wife’s IRA and my own Roth IRA. These were dollars I would have contributed anyway; I simply combined them into a larger single contribution rather than having these contributions scheduled to be deposited on each payday. I also—barely—got a Roth IRA conversion completed before 2018 ended. I sent the paperwork in on December 26, 2018. (Those of you intending to do a Roth IRA conversion near the end of this year would be prudent to file the paperwork by mid-December to allow for a margin of error.) On January 1, I submitted the paperwork to do another Roth IRA conversion while prices were still low, but with the tax impact affecting 2019 instead of 2018 taxes.
I also benefited from the automatic monthly contributions to my 403(b) account being made near the end of each calendar month. This meant I knew I would be doing additional buying on the dip by simply leaving my 403(b) account alone. When things are intelligently set up in advance, the status quo can be a powerful force for investors who don’t act to change it.
Obviously, I’m talking about all of this with the benefit of hindsight. What if the market had continued to fall in January instead of rebounding? I was prepared to accelerate the timing of more contributions to our IRA accounts. I would have also considered rebalancing my 403(b) if even the lower allocation floor of 15% for any of my funds had not been breached. It would have taken a bear market drop of likely between 25% and 30% for me to have acted. Such drops are the bottom for most bear markets. Once the S&P 500 falls that much, the upside has historically been much greater than the downside.
It’s important to note that I have a long investment horizon, ongoing plans to keep contributing and a salaried job. The latter provides me with a source of cash flow to fund living expenses and other spending. An investor in or nearing retirement would need to consider their cash flow sources and requirements. An allocation to stocks could be left untouched if there are enough other sources that can be tapped to cover cash flow needs for up to four or five years, if needed, to ride out an extended bear market.

-
Stock Market Retreats and Recoveries – The speed at which the U.S. market has recovered from the fourth quarter’s correction is about average given what has occurred since World War II, as this article shows.
-
The Level3 Withdrawal Strategy to Maximize Your Long-Term Wealth – AAII founder James Cloonan outlined his strategy of using both a cash and stock bucket to fund retirement withdrawals.
The percentage of individual investors describing their short-term outlook for stocks as “neutral” jumped to its highest level in three years. The latest AAII Sentiment Survey also shows declines in both optimism and pessimism.
Bullish sentiment, expectations that stock prices will rise over the next six months, fell 4.0 percentage points to 33.5%. The drop keeps optimism below its historical average of 38.5%.
Neutral sentiment, expectations that stock prices will stay essentially unchanged over the next six months, rose 5.7 percentage points to 46.3%. Neutral sentiment was last higher on May 25, 2016 (52.9%). This week’s increase keeps neutral sentiment above its historical average of 31.0% for the 14th time in 16 weeks.
Bearish sentiment, expectations that stock prices will fall over the next six months, pulled back by 1.7 percentage points to 20.2%. Pessimism was lower on February 27, 2019 (20.0%). This is the 11th time in 12 weeks that bearish sentiment is below its historical average of 30.5%.
Neutral sentiment remains at an unusually high level (more than one standard deviation above the historical average) for a second consecutive week. Pessimism is now back at an unusually low level. Historically, unusually high readings for neutral sentiment have been followed by slightly better-than-average six-month returns in the S&P 500 index, while unusually low readings for pessimism have been followed by lower-than-average returns for the S&P 500. The relationship between high neutral sentiment and market outperformance has weakened over the past few years, while the relationship between low pessimism and market underperformance has held up.
This year’s rebound in stock prices has encouraged some individual investors, though others have concerns about its sustainability. Many individual investors are monitoring trade negotiations, particularly between the U.S. and China. Also having an influence are monetary policy, Washington politics (including President Trump), geopolitics, valuations, corporate earnings and the pace of economic growth.
This week’s special question asked AAII members for their opinion about the capital that companies are allocating to share buybacks versus growing (or paying) a dividend. One-third of all respondents (33%) say they prefer companies to pay dividends and/or grow their dividends. About 11% of respondents express a negative view of buybacks, while an additional 6% express concern about buybacks being carried out when stock prices are high. Approximately 22% of respondents say they were fine with both buybacks and dividends or otherwise think companies should have the flexibility to choose between the two. Slightly more than 7% like or are otherwise in favor of buybacks.
Here is a sampling of the responses:
- “As a dividend investor, I much prefer to see a growing dividend. I don’t really see share buybacks as having any long-term benefit to a stock’s price.”
- “Growing the dividend is much more important for many senior investors.”
- “Depends on the individual company’s financial position and objectives. I’m generally positive about buybacks.”
- “I would prefer a dividend but understand the internal benefit of the buyback.”
- “Buybacks often occur at market highs. Give me the dividend please.”

Bullish: 33.5%, down 4.0 points
Neutral: 46.3%, up 5.7 points
Bearish: 20.2%, down 1.7 points
Bullish: 38.5%
Neutral: 31.0%
Bearish: 30.5%
April 18, 2019 Six Measures for Comparing Funds
April 11, 2019 Active ETFs With Special Risks
April 4, 2019 Five Concepts Financially Literate Investors Understand
March 28, 2019 The Yield Curve Inverted (But Don't Fear a Recession)

Discussion
No comments have been added yet. Add your thoughts to the discussion!
You need to log in as a registered AAII user before commenting.
Create an account