

Six Measures for Comparing Funds
by Charles Rotblut | April 18, 2019
Special note: My colleague Wayne Thorp is putting together a collection of timeless and valuable articles from the AAII Journal archives, which are now four decades in length. Given the large amount of great content to choose from, he is seeking your input. Please take a look at the set of candidates he has put together and vote for your favorites. I know Wayne will appreciate your assistance.
While sorting through studies to feature in the Dispatches section of the May AAII Journal, I came across one comparing 21 similar funds from Vanguard and Fidelity. There wasn’t a clear winner between the two fund companies. Vanguard’s funds fared better on some aspects, while Fidelity’s fared better on others. A summary of the comparisons can be found at the end of this week’s opening remarks.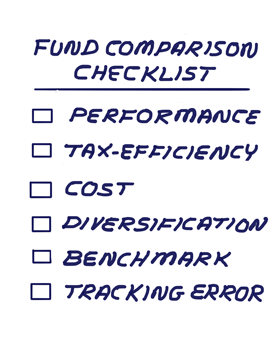
Though I chose not to include the study in next month’s issue because of its narrow scope, I thought there would be interest in what the authors looked at. Many of us have been in situations of trying to choose between two similar funds. Sometimes there is enough difference to clearly choose one fund over another. Other times, the choice is less clear. [Going with the no-commission exchange-traded fund (ETF) or no-transaction-fee fund is not always the cheapest option, especially if you’re investing a significant amount of money.] Having a simple checklist can help make the decision process easier.
Here’s what the study’s authors looked at:
• Performance—Before- and aftertax returns were calculated for one-, three-, five- and 10-year periods. The performance for Fidelity funds was then compared against the Vanguard funds. Pretax returns are widely available. Aftertax returns can be calculated by subtracting the tax-cost ratio listed in our mutual fund guide and our ETF guide from the pretax return. When comparing two funds, simply note how many times one fund performed better than the other and give the fund with the most “wins” preference while realizing the possibility of past returns not being predictive of future performance.
• Tax-Efficiency—The study’s authors calculated the difference between the before- and aftertax return. The tax-cost ratio in our mutual fund and ETF guides gives you this information without requiring additional math. While it may seem repetitive with the aftertax return, the tax-cost ratio makes it clear how tax efficient or inefficient a specific fund is.
• Cost—Three measures were looked at: Expense ratio, turnover and short-term redemption fees. Higher levels of turnover are a drag on performance because of the large amount of transaction fees paid. More transactions can also lead to less tax efficiency. Redemption fees can hurt returns but may expire after a certain period of time. Favor the fund with the lower cost for this component of the analysis.
• Diversification—Portfolio diversification was defined by the authors as the number of securities a fund holds. Smaller portfolios are more concentrated and more likely to be influenced by the movement of a few stocks. Investors should also consider the percentage of the portfolio allocated to the top 10 holdings. Fidelity’s Blue Chip Growth fund (FBGRX), which wasn’t covered by the study but provides a good example, has nearly 400 holdings. It’s not as diversified as it may seem at first since its 10 largest positions accounted for 40.5% of the total portfolio as of March 31, 2019.
• Benchmark—For passively managed funds, the choice of the index influences both returns and tax efficiency. Two funds included in the study’s analysis, The Vanguard Small-Cap Index Fund Admiral Shares (VSMAX) and the Fidelity Small Cap Index fund (FSSNX), use different indexes despite having similar names. The former tracks the CRSP U.S. Small Cap Index while the latter tracks the Russell 2000 index. The study describes the CRSP indexes as being more tax-efficient than the Russell indexes. With the proliferation of ETFs, there has also been massive growth in the number of indexes, so it’s important to look. The methodology for most indexes can be found by simply typing the index’s name into Google or another online search engine. You won’t be able to find out how tax-efficient the index is, but you’ll find enough information to know how it’s constructed.
• Tracking Error—This measures how closely a fund mimics the return of its benchmark. In our mutual fund and ETF guides, we use R-squared to measure tracking error. Index funds should have R-squared values of 100% or very close to it. Actively managed funds should have R-squared values below 90%, or even below 80%, because otherwise you will be paying a higher expense ratio to get the return characteristics of a cheaper passively managed fund.
As to whether you should prefer Fidelity or Vanguard funds, the answer depends on what characteristics matter to you. “Vanguard wins in aftertax return, tax-cost, turnover and diversification. Fidelity wins in expense ratio and tracking precision. For the before-tax return, Vanguard and Fidelity have won or lost by different methods, and the difference is small,” wrote the study’s authors.

-
How to Measure the Skills of Your Fund Manager – Those of you who want to learn more about the R-squared measure and how to use it should read this article.
-
The Four Groups of ETFs – Recognizing an ETF as being vanilla, active, strategic or idiosyncratic can help you to grasp its characteristics and differentiate it from other funds you may be considering.
The percentage of individual investors describing their short-term outlook for stocks as “neutral” is at an unusually high level for the first time in nine months. Pessimism also rose in the latest AAII Sentiment Survey, while optimism fell.
Bullish sentiment, expectations that stock prices will rise over the next six months, pulled back by 2.7 percentage points to 37.6%. The decline puts optimism back below its historical average of 38.5% for the sixth time in seven weeks.
Neutral sentiment, expectations that stock prices will stay essentially unchanged over the next six months, rose 1.3 percentage points to 40.6%. Neutral sentiment was last higher on July 26, 2018 (41.6%). This week’s increase keeps neutral sentiment above its historical average of 31.0% for the 13th time in 15 weeks.
Bearish sentiment, expectations that stock prices will fall over the next six months, rebounded by 1.4 percentage points 21.8%. This is the 10th time in 11 weeks that bearish sentiment is below its historical average of 30.5%.
Neutral sentiment is now at an unusually high level (more than one standard deviation above the historical average). Historically, such readings have been followed by slightly better-than-average six-month returns in the S&P 500 index. Bearish sentiment is back within its typical range after having fallen to an unusually low level last week.
This week’s special question asked AAII members which factors are most influencing their six-month outlook for stocks. Responses are very mixed. Trade, particularly negotiations between the U.S. and China, is mentioned by 17% of respondents. Monetary policy and the direction of interest rates is second, named by 12% of respondents. About 10% of respondents say Washington politics, particularly President Donald Trump, while 5% say geopolitical issues. Slightly more than 9% view market valuations as being too high. The pace of global economic growth, domestic economic growth and second-quarter earnings season were cited by groups representing 8% of all respondents. Some respondents listed more than one factor.
Here is a sampling of the responses:
- “It appears that the global economy continues to grow, and corporate revenue and profits should as well.”
- “Resolution of trade conflict with China and expectation for no further increases in interest rates.”
- “President Trump and his unpredictability.”
- “An aging bull market, somewhat high valuations and the possibility of a recession looming.”
- “World politics and negotiations with China.”

Bullish: 37.6%, down 2.7 points
Neutral: 40.6%, up 1.3 points
Bearish: 21.8%, up 1.4 points
Bullish: 38.5%
Neutral: 31.0%
Bearish: 30.5%
April 11, 2019 Active ETFs With Special Risks
April 4, 2019 Five Concepts Financially Literate Investors Understand
March 28, 2019 The Yield Curve Inverted (But Don't Fear a Recession)
March 21, 2019 Managing the Five Big Types of Investing Risk

Discussion
JH from CA posted over 7 years ago:
Please, Please stop with the "FREE AAII SPECIAL REPORT" pop-up ads!
You need to log in as a registered AAII user before commenting.
Create an account