

Stock Screens Can Help You to Beat the Market
by Charles Rotblut | March 14, 2019
Among the challenges faced by investors who want to actively pick stocks is finding those with desirable traits. There are often companies with good stories and/or receiving lots of attention with risky or lousy stocks (aka good company/bad stock). There are also many good stocks sitting off the radar of most professional and individual investors.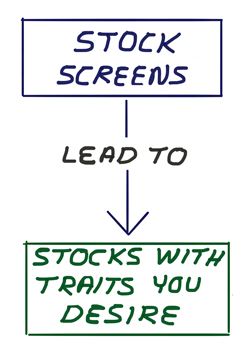
A highly effective solution to this problem is to use a stock screen. Stock screens are database filters designed to identify stocks with specific quantitative criteria. Unlike humans—whose decisions are frequently influenced by irrelevant factors—stock screens are objective. A stock either has the required characteristics or it doesn’t. There are no shades of gray.
This objectivity is what makes stock screens an effective tool. They reduce the entire universe of stocks down to a manageable list from which further research can be done. Some of the stocks passing a given screen may be familiar names, others will be ones you have either limited or no familiarity with. All will have the basic traits used in the screen to identify potentially appealing investments. It is this process of giving you a systematically created and regularly updated list of stocks possessing desired traits that makes stock screens an effective tool.
I’m a proponent of stock screening because I have used stock screeners for 20 years (even prior to joining AAII and using our Stock Investor Pro screening and database program), because I believe in systematic approaches to investing and, most importantly, because well-thought-out stock screens work. Over approximately the last 20 years, 51 of the 59 screening strategies maintained on AAII.com have beaten the S&P 500 index. Two of the eight screens with lousy returns are ones that investors should rationally expect to perform poorly: (Earnings) Estimates Revisions Down 5% and Estimate Revisions Lowest 30 Down.
The stock screening approach results we show in the Stock Ideas section of our website assume that an investor buys every stock passing a given strategy with equal dollar amounts, holds the portfolio for a month and then replaces it with a new portfolio based on the stocks passing the methodology a month later. The performance figures do not consider the commission or other transaction costs (e.g., bid/ask spreads, etc.) an investor using a real-money portfolio would incur. The results do, however, shed light on what works and what doesn’t work.
Those preferring results for actual portfolios can look at the performance of our Model Shadow Stock Portfolio and Stock Superstars Report portfolios. All stocks added to these real-money portfolios are those identified directly from stock screening strategies. Since its inception in 1993, the Model Shadow Stock Portfolio has returned 14.6% annually versus 9.2% for the Vanguard 500 Index fund (VFINX) as of January 31, 2019. The Stock Superstars Report, which was started in 2002, has an annualized return of 8.0% versus 7.3% for the Vanguard 500 Index fund. The performance figures for these two portfolios include all of the commission and transaction costs encountered while managing them through actual real-money brokerage accounts.
The screen chosen, the ability to stick with it and having disciplined sell rules all matter. Good screens will incur periods of both out- and underperformance—as is the case with both actively managed and passively managed (“index”) approaches. If value is out of favor, a value-oriented screen will underperform. If growth is in favor, a growth-oriented screen is likely to do better. If small-cap stocks are outperforming, the stock screens that are targeting them are more likely to outperform market-cap-weighted approaches like S&P 500 index funds.
Due diligence is also required when using a stock screen. There can always be factors outside of the screen’s criteria that could influence your decision about whether to buy a passing stock (e.g., a recent profit warning that is not yet factored into the data).
Yet, even with these caveats, the good screens do outperform over time and reward those investors who have the discipline to stick with them. Good screens are those based on research that has been shown to lead to long-term outperformance. Such screens have criteria that make economic sense; in other words, there is a logical reason as to why they should work.

-
Guide to Stock Screening – This primer provides suggestions on how to choose a screen and analyze its performance.
-
Constructing Winning Stock Screens – This four-step process from AAII president John Bajkowski can help you either build your own screen or better determine how to use an existing screen in your portfolio.
Pessimism among individual investors about the short-term direction of the stock market is at a six-week high. The latest AAII Sentiment Survey also shows a further decline in optimism and a slight increase in neutral sentiment.
Bullish sentiment, expectations that stock prices will rise over the next six months, fell 5.0 percentage points to 32.4%. Optimism was last lower on January 30, 2019 (31.8%). The historical average is 38.5%.
Neutral sentiment, expectations that stock prices will stay essentially unchanged over the next six months, rose 0.7 percentage points to 36.5%. During the last seven weeks, neutral sentiment has fluctuated within a range of 35.3% to 39.8%. Neutral sentiment is above its historical average of 31.0% for the eighth time in 10 weeks.
Bearish sentiment, expectations that stock prices will fall over the next six months, rose 4.3 percentage points to 31.1%. Pessimism was last higher on January 30, 2019 (31.8%). This week’s increase puts bearish sentiment back above its historical average of 30.5% for the first time in six weeks.
A pullback in optimism following a very brief stint of above-average readings is nothing new. (Bullish sentiment was above average on February 20, 2019, and February 27, 2019.) Since February 28, 2018, optimism has been below average on 41 out of 55 weeks.
At current levels, all three indicators are within their typical historical ranges.
This year’s rebound in stock prices has encouraged some individual investors, though others have concerns about its sustainability. Many individual investors are monitoring trade negotiations, and the tempering of tensions may be having an impact on sentiment. Also having an influence are Washington politics (including President Trump and Democratic control of the House of Representatives), corporate earnings, the Federal Reserve, valuations and concerns about the pace of economic growth.
This week’s special question asked AAII members what influence fourth-quarter earnings are having on their outlook for stock prices. Slightly more than a third of all respondents (36%) say the recent profit announcements are not having an influence. Some of these respondents say monetary policy matters more, while others say politics and/or trade issues are having a bigger influence. Nearly 23% express a negative view about earnings or earnings guidance. Several of these respondents think earnings growth has peaked or pointed to negative 2019 earnings estimate revisions. About 17% view corporate earnings as being positive or otherwise confirming an ongoing trend of growth.
Here is a sampling of the responses:
- “Earnings are important, but the Fed’s influence has more impact on prices.”
- “They contribute to the belief that equity prices will go down in response to declining economic activity.”
- “The generally high earnings have helped me to be bullish on the market.”
- “The downward revisions to 2019 earnings had more influence on my outlook than fourth-quarter earnings did.”
- “Not much! The market is very sensitive to news and wide fluctuations are the norm.”

Bullish: 32.4%, down 5.0 points
Neutral: 36.5%, up 0.7 points
Bearish: 31.1%, up 4.3 points
Bullish: 38.5%
Neutral: 31.0%
Bearish: 30.5%
March 7, 2019 We’re Improving Our Website
February 28, 2019 Warren Buffett Deemphasizes Book Value as a Key Metric
February 21, 2019 Avoiding Overconfidence by Knowing What Type of Investor You Are
February 14, 2019 Your Returns May Be Anything but Average

Discussion
No comments have been added yet. Add your thoughts to the discussion!
You need to log in as a registered AAII user before commenting.
Create an account