



Whether investing or cooking, choosing ingredients can be difficult.
One of our favorite ways to cook is with Dutch ovens, and my specialty dish is cheesy potatoes with bacon and onions. I choose my ingredients carefully for maximum flavor. Idaho potatoes, Tillamook sharp cheddar cheese, double-smoked double-thick bacon, chopped & sautéed Walla Walla onions plus just the right amount of salt and pepper. Obviously, the goal isn’t heart health. The goal is a mouthwatering splurge of a treat that has most people coming back for seconds, and these ingredients deliver that in abundance.
Choosing ingredients for an investing portfolio has similar challenges. To start with, you need to know the investing philosophy the portfolio is based on. Then, you can create criteria and start winnowing down the options until you have the best choices for each ingredient or asset class.
The investing recipe I’ve been optimizing for several years now is Paul Merriman’s Ultimate Buy and Hold equity portfolio. It’s based on the idea of delivering to investors a higher return per unit of risk than the S&P 500 index through a massively diversified global portfolio with tilts to small and value equities. It includes equal 10% weights of the 10 asset classes shown in Table 1.
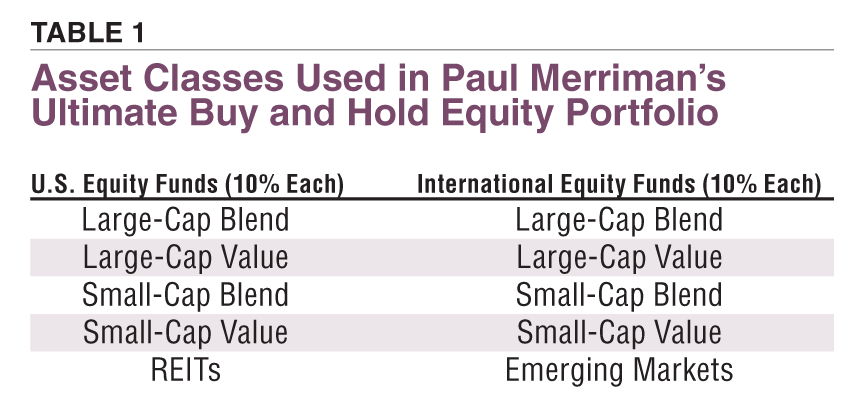
The result is a portfolio that is half U.S. and half international, half large and half small, half pure value and half blend (mix of growth and value). In other words, it places no large bets, so there is less chance of feeling regret when one asset class outperforms another. By equal weighting the asset classes and using blend instead of growth funds, it has more exposure to small and value than a market-cap-weighted approach such as the S&P 500 or a total market index. Lastly, because these asset classes are broad, the resulting portfolio holds thousands of companies, which further reduces risk and potential investor regret because they can own at least a little of everything that’s likely to matter.
There are many ways to implement this portfolio. For years, Merriman has recommended mutual funds for each asset class. These are still a very practical option, but they require that investors manually implement purchases and rebalancing. For investors who want to avoid such complexities, there are now platforms such as M1 Finance (www.m1finance.com) that will automate those steps using exchange-traded funds (ETFs) and do so with no commissions. This simplifies the investing process significantly, putting much of it on autopilot and thus removing the opportunity for emotions to get in the way when buying and selling. Because of this, I’ve focused more of our best-in-class asset selection work on ETFs.
Steps for Choosing Among ETFs
If we want to implement this portfolio using ETFs, which ones would be best and what criteria should we use to choose them?
Some criteria are obvious. We want low expense ratios, large diversification (number of companies per fund) and low turnover. Since ETFs trade on the open market, we’d also like funds that have high trading volumes and low bid-ask spreads. Ideally, we want funds that have ingredients that match their labels too. Some “small-cap” funds hold more mid-cap companies than small and some “value” funds hold more growth and blend companies than pure value. If we use those funds, it’s like choosing bland ingredients and the resulting portfolio won’t deliver nearly what we expect in terms of small company size and value tilt premiums.
 Fortunately, there are many free tools available today for checking the quality and purity of ETFs. Unfortunately, when we use them, we’ll find that none of the options are perfect.
What do we do then if the small-cap value fund with the lowest expense ratio is also the one with the largest and least-value-oriented companies? How do we decide if it’s worth paying more for a fund with smaller companies that are more value-oriented? And, once we’ve chosen all of our funds, how do we make sure they combine nicely in the resulting portfolio?
To break this logjam, we can use several free quantitative tools available on the internet. Here’s the summary for the process I use.
-
Select candidate funds for each asset class at ETF.com (www.etf.com);
-
Collect basic fund attributes from ETF.com (www.etf.com) and Morningstar (www.morningstar.com);
-
Analyze historical fund factor exposures at Portfolio Visualizer (www.portfoliovisualizer.com);
-
Estimate expected fund returns based on historical premiums;
-
Select best-in-class funds for each asset class; and
-
Run Morningstar X-Ray of resulting portfolio & iterate if needed.
(Editor’s note: AAII members have access to comprehensive data on exchange-traded funds, including turnover and tax-cost ratios, which can be used for steps 1 and 2, at www.aaii.com/guides/etfguide.)
To illustrate, let’s look just at U.S. small-cap value funds.
Step 1
According to the screener at ETF.com, there are 12 U.S. small-cap value fund candidates: First Trust Small Cap Value AlphaDEX (FYT), iShares Russell 2000 Value (IWN), iShares S&P Small-Cap 600 Value (IJS), iShares Morningstar Small-Cap Value (JKL), Invesco S&P SmallCap 600 Pure Value (RZV), Invesco S&P SmallCap Value with Momentum (XSVM), Opus Small Cap Value Plus (OSCV), PGIM QMA Strategic Alpha Small-Cap Value (PQSV), SPDR S&P 600 Small Cap Value (SLYV), Vanguard Small-Cap Value (VBR), Vanguard S&P Small-Cap 600 Value (VIOV) and Vanguard Russell 2000 Value (VTWV).
Step 2
Compile the information from ETF.com and combine it with turnover and tax-cost ratio from Morningstar as shown in Table 2. (Editor’s note: AAII members can find much of this ETF data on AAII.com.)
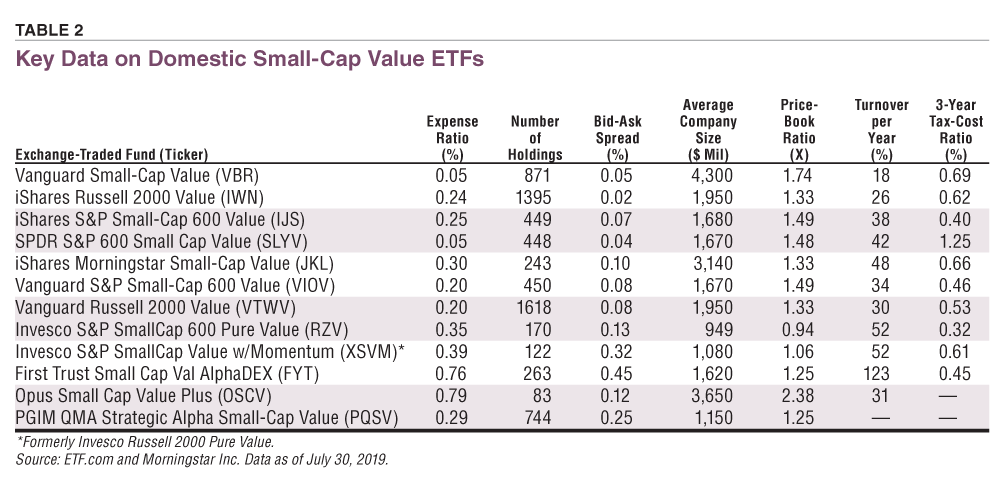
As you might surmise after looking at the data in Table 2, there’s no perfect fund. The funds with the smallest companies and lowest price-to-book ratios (e.g., Invesco S&P SmallCap 600 Pure Value) also have some of the highest expense ratios, bid-ask spreads and smallest numbers of holdings. So, we go on to step 3.
Step 3
By using the free Factor Regression tool in the Factor Analysis section of Portfolio Visualizer (www.portfoliovisualizer.com/risk-factor-allocation), we can find out how well these funds have delivered the small and value premiums over their history.
Three of the funds listed (Vanguard S&P Small-Cap 600 Value, Opus Small Cap Value Plus and PGIM QMA Strategic Alpha Small-Cap Value) have less than 10 years of available history, which isn’t a lot for a regression analysis, so I’m going to leave them out. If they were stunning in other ways, I might accept the shorter time frame for the analysis, but they’re not, so going for the longer time frame seems a better decision. By eliminating those three ETFs, we can extend the factor analysis back to 2006, which captures the 2008 market downturn and recovery.
There are many different options in the factor regression settings at Portfolio Visualizer, and you’ll find much documentation there describing them. The ones I used for this analysis are the AQR Four-Factor Model with HML-DEV, Quality and Low-Beta factors enabled and a common time frame. Figure 1 shows the results as of July 30, 2019. Don’t be scared by all the unfamiliar terms. We’ll walk through them. Note that Invesco Russell 2000 Pure Value (XSVM), the last name in Figure 1, is now called Invesco S&P SmallCap with Momentum.
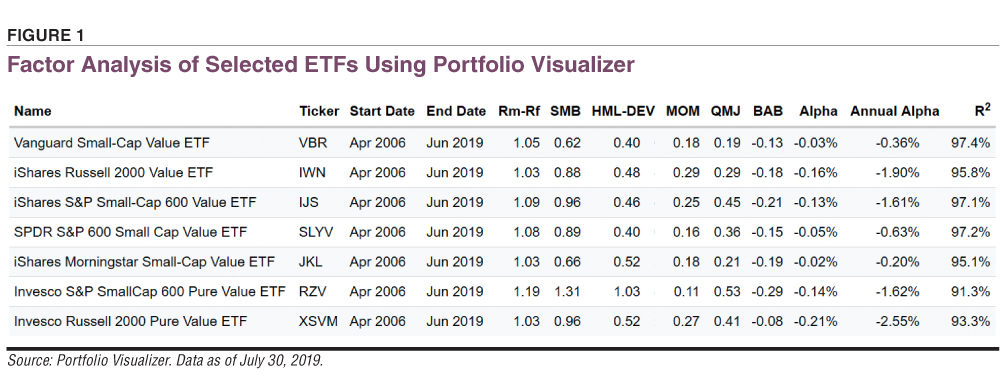
What do all the numbers in Figure 1 tell us?
First and foremost, they tell us how much of each fund’s performance has likely been due to the various risk-premium factors in the model—namely market (Rm-Rf, which is stock market returns less risk-free returns), size (SMB, meaning small minus big), value (HML-DEV, high book-to-price less low book-to-price rebalanced monthly; book-to-price is the inverse of price-to-book), momentum (MOM, strong minus weak), quality (QMJ, quality minus junk) and low volatility (BAB, betting against beta, or high volatility). A zero would mean no exposure or benefit from the factor, a one would mean complete exposure to the factor and something greater than one means exaggerated exposure to the factor. Since these are supposed to be small-cap value equity funds, we would expect higher numbers for the market (Rm-Rf), small (SMB) and value (HML-DEV) factors, and that’s indeed what we see.
The analysis also tells us how much added value or cost is wrapped up in everything else, including trading and expenses by way of the annual alpha percentage.
Finally, the R-squared number tells us how well the model characterizes the past performance of the funds. The higher the R-squared, the better the fund performance is explained by the model the academics have created. The first five funds all have an R-squared above 95%, which says the factor model was able to explain almost all of their returns. For the last two on the list, the R-squared values are lower and suggest that they had active management, changing factor exposures, good or bad luck or other anomalies that reduced the ability of the model to describe their returns.
Now that we’ve covered the terms, let’s look at how the ETFs differ. Not surprisingly, the Vanguard Small-Cap Value fund has the lowest small-factor exposure since it has the largest average company size. It’s also not surprising that the fund with the lowest price-to-book (Invesco S&P SmallCap 600 Pure Value) had the highest value factor (HML-DEV) exposure. The relatively low value exposure for Invesco S&P SmallCap Value with Momentum (ticker XSVM, listed as Invesco Russell 2000 Pure Value in Figure 1) is likely because it has changed underlying indexes three times over the analyzed period. Though these aren’t explicitly momentum (except Invesco S&P SmallCap Value with Momentum), quality or low-volatility funds, it’s nice to see that they have some positive factor exposure in these areas too since broader factor exposure is a positive form of diversification that can improve returns per unit of risk. Once again though, there are no perfect solutions, so it’s time to go to step 4.
Step 4
To estimate expected fund returns based on historical premiums, we start by retrieving the factor return statistics for the AQR model from the Factor Statistics link in the Factor Analysis section of the Portfolio Visualizer website. The historical premiums for each of the factors from January 1964 through June 2019 were as follows:
- Market (Rm-Rf): 5.05%
- Size (SMB): 1.40%
- Value (HML-DEV): 2.61%
- Momentum (MOM): 7.47%
- Quality (QMJ): 4.43%
- Low Beta (BAB): 9.79%
Now, we multiply the factor exposures from step 3 by the long-term historical expected premiums for each of the factors from step 4 and then add the fund annual alphas from step 3 to get an expected or factor-predicted future return. Here’s what that looks like for the Vanguard Small-Cap Value fund:
Factor-Predicted Return = (5.05%  (FYT) 1.05) + (1.40% (FYT) 0.62) + (2.61% (FYT) 0.40) + (7.47% (FYT) 0.18) + (4.43% (FYT) 0.19) + (9.79% (FYT) –0.13) – 0.36% = 7.77%.
 To be clear, nothing including this formula can accurately predict what we will get as a future return. All this tells us is what we would get if future factor premiums and fund exposures match the past. The reason it’s interesting isn’t that it tells us precisely what we’ll get in the future, but rather that it gives us an objective way to compare and choose between funds based on historical actual performance.
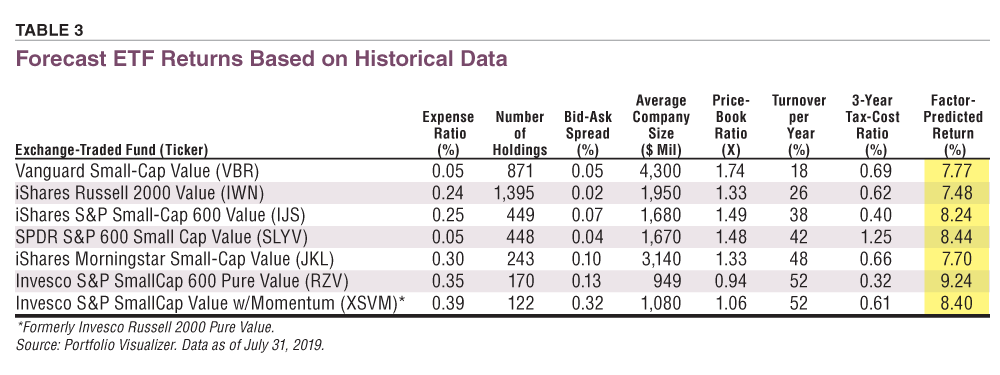
If you create a free account at Portfolio Visualizer, you’ll be able to download an Excel spreadsheet of the multi-fund factor regression, which simplifies the analysis. Table 3 shows the results.
Step 5
Select the best-in-class fund to test.
Based purely on the factor-predicted returns, the Invesco S&P SmallCap 600 Pure Value ETF would be our first choice. At the same time, it has the next-to-smallest number of holdings, next-to-largest expense ratio, next-to-largest bid-ask spread and is tied for the highest turnover among the candidate funds. It also had the lowest R-squared value for the factor regression analysis, which suggests that it may not consistently deliver what we want in the future. Given these attributes, the fund with the second-highest predicted return, SPDR S&P 600 Small Cap Value, looks comparatively appealing with one-seventh the expense ratio, more than twice the holdings, one-third the bid-ask spread and one-third the turnover. The iShares S&P Small-Cap 600 Value fund is very similar to SPDR S&P 600 Small Cap Value, but has better tax efficiency, so might be the better choice in taxable accounts. If either one of those funds is considered to be the top candidate, we can take it to the next step.
Step 6
Run the Morningstar X-Ray of resulting portfolio.
The final step is to run the resulting portfolio through the Morningstar Instant X-Ray tool. Since Dimensional Fund Advisors (DFA) have a long and academically grounded history of providing funds and portfolios that take advantage of the small and value premiums, we use an Ultimate Buy and Hold portfolio implemented with their mutual funds as a reference. The results for the DFA reference portfolio and our 2018/2019 best-in-class ETFs are presented in Figure 2.
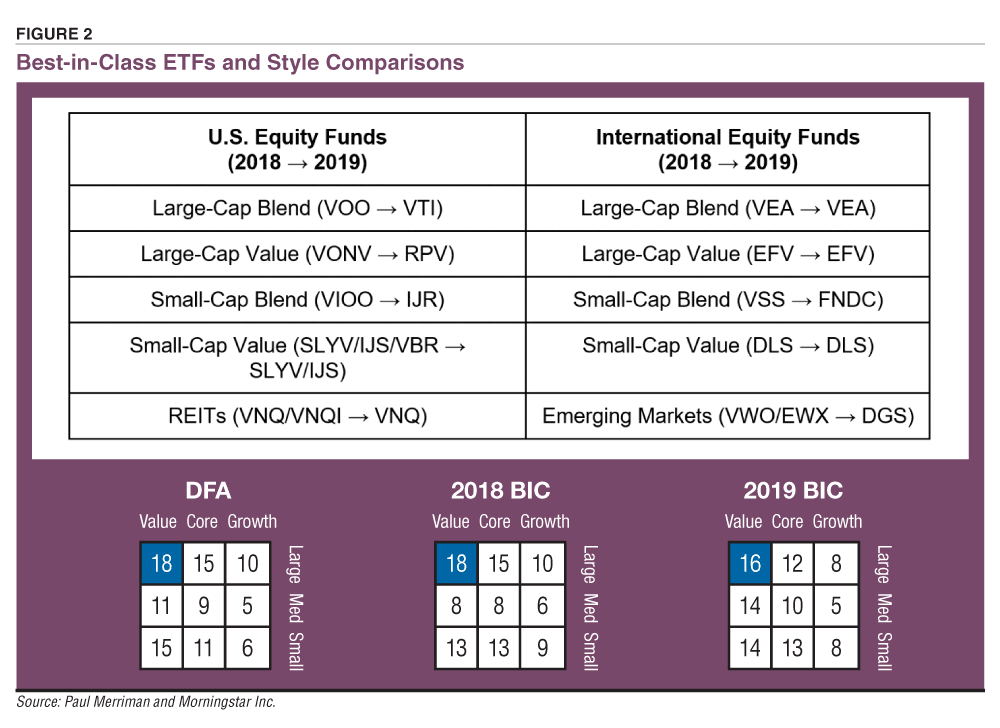
What’s clear from the X-Ray is that the 2019 portfolio has a much stronger value tilt, which is in line with the DFA benchmark portfolio. There is also a shift toward smaller companies. Both of these changes fit well with the philosophy of delivering higher returns with tilts to small and value equities, which lies at the core of the Ultimate Buy and Hold portfolio. In other words, the 2019 suggestions are better ingredients for this recipe.
Additional Observations
This is certainly not the only way to choose best-in-class ETFs, but it’s a way to do it that overcomes many of the pitfalls in fund selection. You’ll notice that we never looked at recent performance, which can tempt us to recommend the fund that’s done well recently but is likely to underperform in the near future. We also didn’t consider star ratings or grades from fund analysts.
The primary focus of this process is to find funds that deliver on the factor premiums that history suggests have a high chance of delivering in the future. There are no guarantees of future performance, but if we want the best chance of success, it’s good to know that the ingredients we’re choosing for our portfolios are as pure and clean as possible. Since the funds are chosen on the basis of long-term consistent performance, barring unexpected changes, we update the analysis every year or two.
For a more detailed look at the 2019 best-in-class ETF selection process, recommended funds and further analysis comparing DFA, 2018 and 2019 best-in-class recommendations, please go to https://paulmerriman.com/best-in-class-etfs-for-the-ultimate-buy-and-hold-2019.
Related

Portfolio Strategies
How to Take Advantage of Risk Factors
Related

Portfolio Strategies
Factors Allow Investors to Think Differently About Diversification
Discussion
FREE REPORT

Get your free copy of our special
report analyzing the tech stocks
most likely to outperform the
market.
Ms. Sneha Joshi from VA posted over 7 years ago:
Chris Pedersen from California posted over 7 years ago:
Ms. Sneha Joshi from VA posted over 7 years ago:
Ms. Sneha Joshi from VA posted over 7 years ago:
Amish from VA posted over 6 years ago:
Dave G from WA posted over 6 years ago:
Ms. Sneha Joshi from VA posted over 6 years ago:
Sneha J from IND posted over 4 years ago:
Mirza B from OH posted over 4 years ago:
You need to log in as a registered AAII user before commenting.
Log InCreate an account