

Risk-Off Environment Leads to More Shadow Stock Candidates

After conducting the quarterly review, two stocks were removed from the portfolio, freeing up funds for the purchase of three new holdings.

Featured Tickers:

After conducting the quarterly review, two stocks were removed from the portfolio, freeing up funds for the purchase of three new holdings.


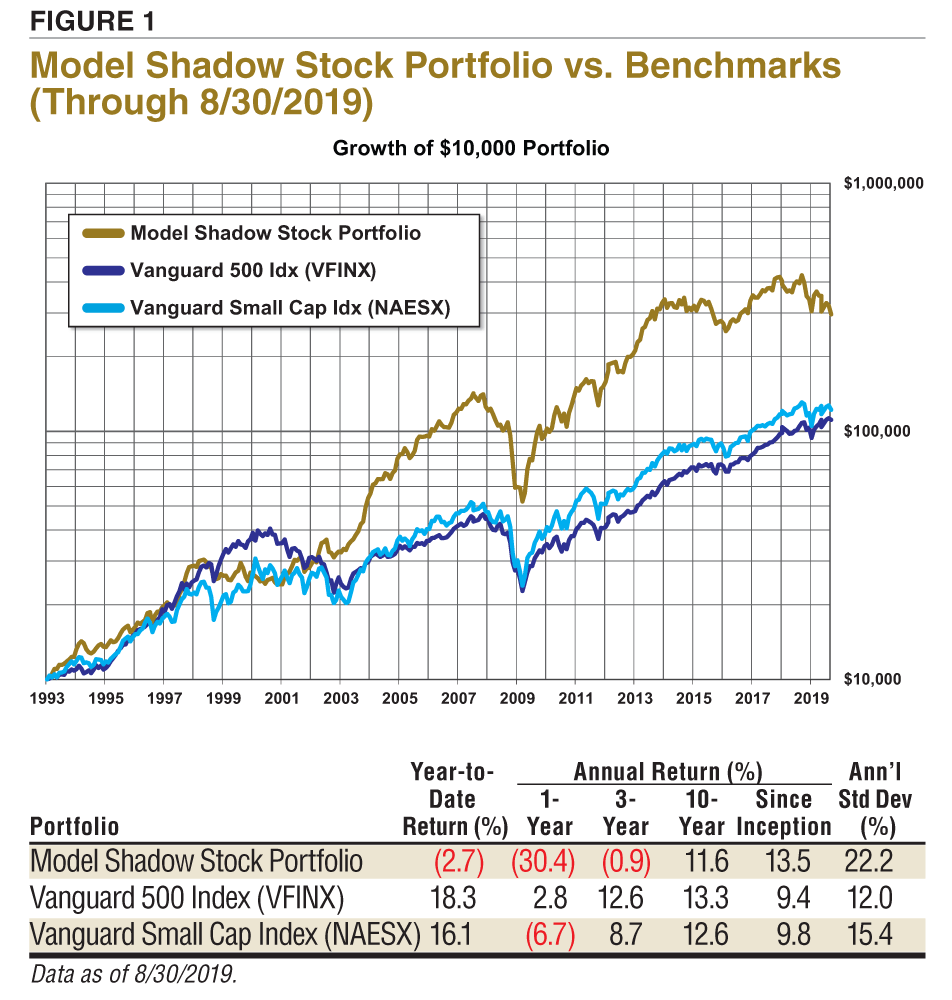
While stocks were down across the board during August, the stock prices of smaller-cap value stocks were weaker in a risk-off market environment. The S&P 500 index as measured through the Vanguard 500 Index fund (VFINX), was down 1.6% during August, lowering its year-to-date performance to 18.3%. The Model Shadow Stock Portfolio lost 7.8% during August, pushing its 2019 year-to-date performance into the red with a loss of 2.7% for the year. The S&P MidCap 400 index was down 4.2% during August and is now up 14.4% for the year, while the Russell 2000 index lost 4.9% during the month and is up 11.8% year to date. The Vanguard Small-Cap Index fund (NAESX) was down 4.0% during the month and has a year-to-date performance of 16.1%. Figure 1 shows performance over longer periods.

In the large-cap segment, value stocks have year-to-date performance of 15.7%. Large-cap growth stocks have outperformed all segments with a year-to-date return of 20.7%. Mid-cap value stocks are up 11.8%, while mid-cap growth stocks are up 16.8% for the year. Small-cap value stocks are up 7.3% year to date, while small-cap growth stocks are up 16.3%.

Since its inception in 1993, the AAII Model Shadow Stock Portfolio has a compound annual average return of 13.5% versus the Vanguard 500 Index fund’s gain of 9.4% per year on average over the same period. Over the same period, the Vanguard Small-Cap Index fund posted an average annual gain of 9.8%.


Portfolio Changes

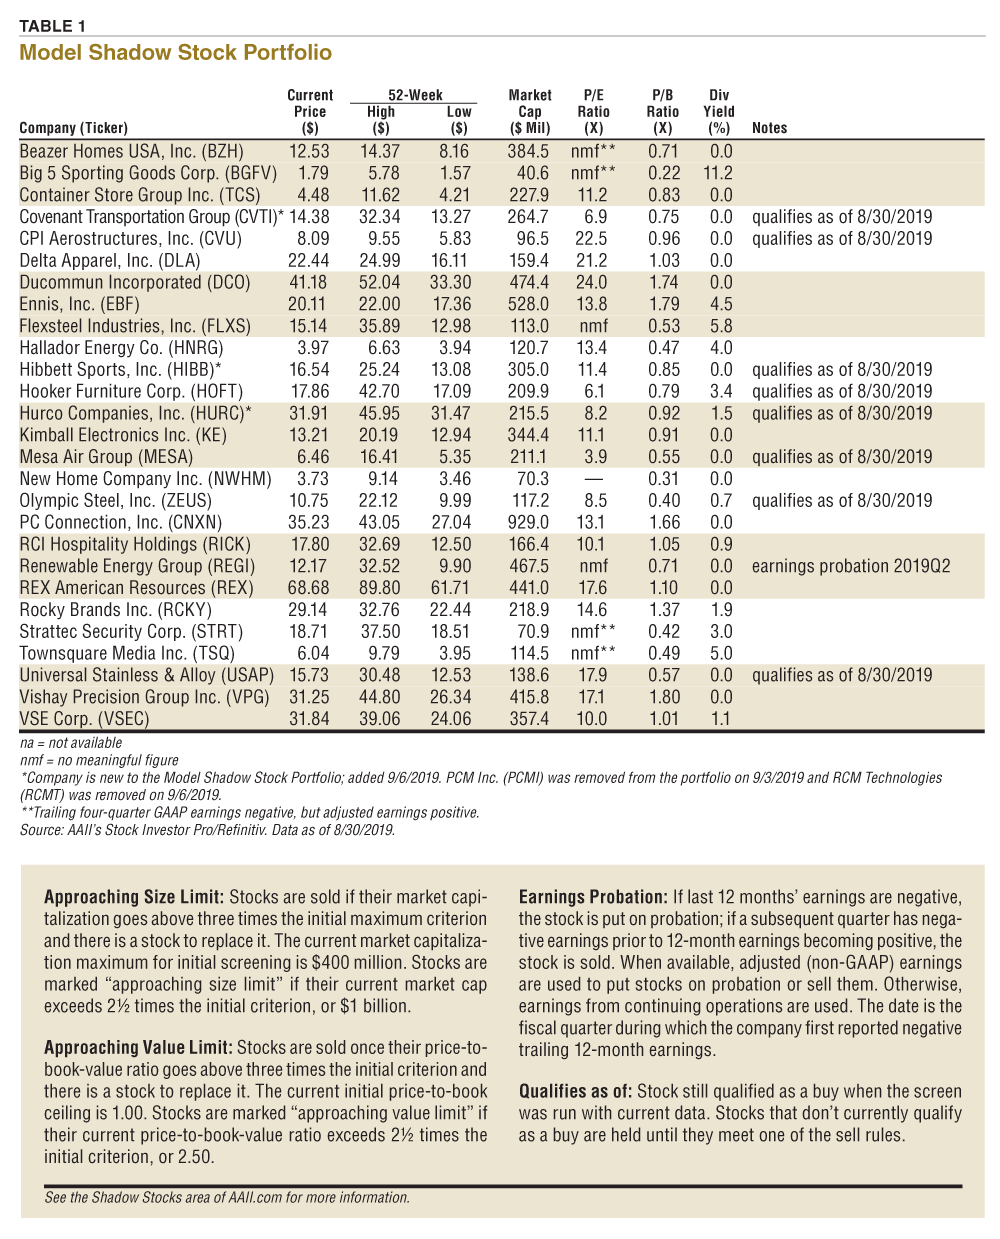
Table 1 shows the current holdings in the Model Shadow Stock Portfolio.

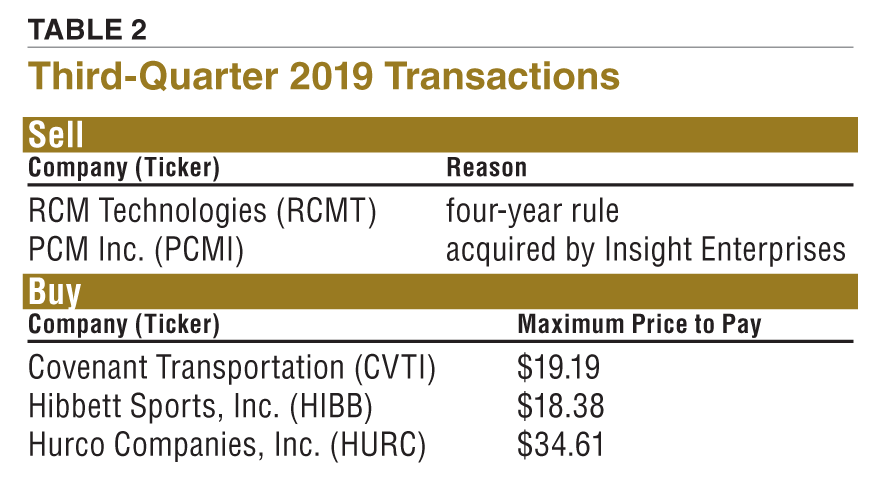
After conducting the quarterly review of the Model Shadow Stock Portfolio, RCM Technologies (RCMT) was removed from the portfolio. In addition, following the completion of its acquisition by Insight Enterprises, PCM Inc. shares were tendered. The proceeds from these two positions, as well as the cash held in the portfolio allowed us to add three new stocks to the Model Shadow Stock Portfolio. We try not to underweight or overweight new positions. Instead, it is better to hold excess cash until there is enough to buy a new stock with a position size roughly equivalent to the average position size in the portfolio. Table 2 summarizes the changes.
 

Sold: RCM Technologies (RCMT)

RCM Technologies was removed based on the Model Shadow Stock Portfolio’s “four-year rule,” which allows for the removal of a Shadow Stock held at least four years that has not posted an average annual gain of at least 10%, provided that a suitable replacement is available. The rule was introduced in the January 2018 AAII Journal.
RCM Technologies is a global provider of engineering, information technology and specialty health care services. RCM Technologies was held for more than 13 years in the portfolio but has posted a loss since purchase.

Tendered: PCM Inc. (PCMI)

On June 24 it was announced that Insight Enterprises and PCM Inc. had entered into an agreement under which Insight Enterprises will acquire PCM Inc. for $35 per share for a total transaction value of $581 million. At the time, this represented a 36% premium to PCM Inc.’s one-month average closing share price as of Friday, June 21, 2019.

On August 30, Insight Enterprises announced that it completed the PCM Inc. acquisition. The shares were tendered in early September for $35 a share.

Quarterly Additions

As of the end of August, 35 stocks met the initial selection criteria for the Model Shadow Stock Portfolio, up from 30 at the end of July and 23 at the end of June. The weakness of small-cap value stocks has increased the number of stocks falling below the maximum market-cap size filter of $400 million and the price-to-book-value ceiling of 1.00. AAII members can see and research which companies are currently passing the initial selection criteria in the Shadow Stock Ideas table on AAII.com. The list of new Shadow Stock Ideas is updated daily—Tuesday through Saturday.

Of the 35 qualifying companies at the end of the month, five were held in the Model Shadow Stock tracking portfolio: CPI Aerostructures Inc. (CVU), Hooker Furniture Corp. (HOFT), Mesa Air Group (MESA), Olympic Steel Inc. (ZEUS) and Universal Stainless & Alloy Products (USAP). These stocks are noted as qualifying in Table 1.

Purchased: Covenant Transportation Group (CVTI)

Covenant Transportation is a provider of expedited long-haul freight transportation, primarily using two-person driver teams in transcontinental lanes. Covenant Transportation’s services also include refrigerated, dedicated, cross-border, regional and brokerage.

Based on Covenant Transportation’s book value per share as of September 5, we suggest paying no more than $19.19. To calculate the maximum buy price based on the price-to-book-value ratio, multiply the current share price by the ratio of the maximum price-to-book ratio to be considered for the Model Shadow Stock Portfolio (currently 1.0) to the current price-to-book ratio of the stock. The price-to-book ratio for Covenant Transportation is 0.806, so the calculation is: [$15.47 (CVU) (1.0 ÷ 0.806)] = $15.47 (CVU) 1.241 = $19.19.

Purchased: Hibbett Sports, Inc. (HIBB)

Hibbett Sports operates athletic specialty stores in small- and mid-sized markets in the South, Southwest, Mid-Atlantic and the Midwest regions of the U.S.

Based on Hibbett Sports’ book value per share as of September 5, we suggest paying no more than $18.38.

Purchased: Hurco Companies, Inc. (HURC)

Hurco Companies is an industrial technology company that designs, manufactures and sells computerized [computer numeric control (CNC)] machine tools. These machine tools consist primarily of vertical machining centers (mills) and turning centers (lathes). Hurco Companies operates in the industrial automation equipment segment. It provides software options, control upgrades, accessories and replacement parts for its products, as well as customer service and training support and applications support.

Based on Hurco Companies’ book value per share as of September 5, we suggest paying no more than $34.61.

Next Portfolio Review

The next quarterly review of the Model Shadow Stock Portfolio will take place at the end of November. In the meantime, you can follow the portfolio in the AAII Shadow Stocks area on AAII.com (www.aaii.com/model-portfolios). To receive monthly email updates along with alerts when any changes are made to the portfolio, please sign up at www.aaii.com/email

Shadow Stock Portfolio Rules

Purchase & Sales Rules

Stock purchases must meet these criteria:

  • No bulletin board or pink sheet stocks will be purchased.
  • Price-to-book-value ratio must be less than or equal to 1.00. (This figure will change gradually with changes in overall market values.)
  • Market capitalization must be between $30 million and $400 million. (This figure will change gradually with changes in overall market values.)
  • The firm’s last quarter and last 12 months’ earnings from continuing operations must be positive and, if there are earnings estimates, the estimates must be positive for the current quarter and year.
  • No financial stocks or limited partnerships will be purchased.
  • No stocks in the utility sector will be purchased.
  • No stocks in the rental and leasing industry will be purchased.
  • No stock on foreign exchanges or ADRs will be purchased because of different accounting and/or withholding tax on dividends. Foreign stocks traded on U.S. exchanges are OK with one exception: The stock of any company whose primary business is in China will not be purchased.
  • The share price must be greater than $4.
  • In order to reduce trading by avoiding stocks that are forever marginal, any stock that was sold within two years will not be rebought.
  • Note second item under Stock Order Guidance concerning spreads when buying shares.
  • Price-to-sales ratio must be less than 1.2. (This figure may change gradually with changes in overall market values.)
  • Eliminate any company that failed to file a 10-Q (quarterly) report in the last six months.
  • Momentum is used as a tie-breaker among qualifying stocks. A ranking on four-week relative strength is used as a tie-breaker.

Stocks are sold if any of the following occur:

  • If last 12 months’ earnings are negative, the stock is put on probation; if a subsequent quarter has negative earnings prior to 12-month earnings from continuing operations becoming positive, the stock is sold. When available, adjusted (non-GAAP) earnings are used to put stocks on probation or sell them. These are earnings that have been adjusted to eliminate the impact of non-recurring events such as markdown of inventory or goodwill. These are earnings reported in the media, in press releases and used in estimates of future earnings. Adjusted earnings are used because the information appears much sooner than official filing data. Otherwise, earnings from continuing operations are used.
  • The stock’s price-to-book-value ratio goes above three times the initial criterion.
  • Market capitalization goes above three times the initial maximum criterion.
  • Stocks that have been held for four years can be sold unless:
    • they currently qualify,
    • they are up more than 40% from their purchase, or
    • there is no qualifying stock to replace them.
  • If a stock has been held for over four years, it needs to be up 10% per year held to avoid being sold (for example, a stock held six years needs to be up 60%). Time and return are based on the initial purchase for the portfolio. Sells are made only if there are suitable replacements.


Stock Order Guidance

  • These rules are for general guidance. Your own experience, market conditions and the size of the position will impact your own decisions. The results in the model portfolio were obtained while sometimes paying more.
  • Market orders are not used. Instead, if the quoted bid-ask spread is less than 2% (ask price minus bid price, divided by ask price), place a limit order at the ask price for a buy and at the bid price for a sell. If the bid-ask spread is more than 2%, try to place a limit order between the bid and ask prices to keep transaction costs low. If necessary, build a position gradually. With low commissions, it is often better to place partial orders than to try to establish a large position all at once. Be patient.
  • The average daily dollar volume should be at least 10 times the amount needed for your position. This will ensure liquidity to get in and out of the position, even if you need to grow the position gradually and sell gradually. This will result in a varying number of qualifying stocks for each investor.
  • If price changes cause a stock to become ineligible (due to changes in price-to-book-value ratio or market capitalization) when only part of the order has been filled, stocks already purchased are kept but the balance of the order is canceled.

Management Rules

  • Equal dollar amounts are invested in each stock initially.
  • Decisions are made only at the end of each quarter. In order to react to the majority of earnings reports as soon as possible, quarterly reviews are done at the end of February, May, August, and November.
  • Best judgment is used for tenders or mergers, but all criteria must be obeyed.
  • At the end of a quarter, if receipts from stocks sold exceed requirements for new purchases, the excess receipts are kept in cash until the next quarter. If too much cash is accumulated, the rules will be adjusted.
  • At the end of a quarter, if receipts from stock sales are insufficient to buy all newly qualifying stocks, purchases are made based on the width of the bid-ask spread and the number of shares at bid or ask price.
  • Note that if you are managing your own portfolio, it should consist of at least 10 stocks. If you are developing the portfolio gradually, you can do it stock by stock, but don’t put more than 10% of your funds in each additional stock. More than 20 stocks is not needed until the portfolio exceeds $1 million.

Discussion

Tony from Illinois posted over 6 years ago:

John, I think your readers (including me) would love to see an explanation of why the model hasn't prevented us from seeing negative results in a year that has been produced exceptional returns for most stock indexes. When does the Shadow Stock portfolio excel? In up markets? Down markets? Only when small cap value beats growth? Or when small caps beat mid and large caps? Would you characterize the Shadow Stock portfolio as being a good defensive portfolio with limited downside when the market is expected to have very moderate growth? I guess we all know WHAT happened, but we'd like an explanation as to WHY?


Andy from CA posted over 6 years ago:

Tony, based on the returns graph there were extraordinary returns from 2003 through 2007. The graph shows data back to 1993 but the transaction data implies the actual portfolio was put in place in late 2003. Returns from 2007 through current (Feb 2020) approximate (slightly lower than) the Vanguard 500 and the Vanguard Small Cap. So, look at the transactions from 2003 and 2007 and find out what was special. My guess is there were one or two home runs and a solid double or two. The return standard deviation implies this not a defensive portfolio (e.g. not for the weak of heart).


You need to log in as a registered AAII user before commenting.
Create an account

Log In

Get your free copy of our special report analyzing the tech stocks most likely to outperform the market.

Download the FREE Report Here:
