




Related

Small Cap Value Investing
A rising stock market combined with more companies reporting negative quarterly and trailing 12-month earnings during the latest earnings reporting cycle resulted in a dramatic decline in qualifying companies.
by John Bajkowski | July 2020

A rising stock market combined with more companies reporting negative quarterly and trailing 12-month earnings during the latest earnings reporting cycle resulted in a dramatic decline in qualifying companies.
Hopes of an economic rebound lifted stock prices during May, with the S&P 500 index gaining 4.8% for the month, trimming its year-to-date loss to 5.0%. The Model Shadow Stock Portfolio gained 7.6% during May but remains down 37.5% year to date. The Vanguard Small-Cap Index fund  (NAESX) has a year-to-date performance of negative 13.7%, while the DFA U.S. Micro Cap fund (DFSCX) is down 22.8% for the year through the end of May.
The performance of growth- versus value-oriented stocks continues to be slanted toward growth stocks.
In the large-cap segment, growth stocks have a positive 3.7% gain year to date through May, while large-cap value stocks are now down 14.7% for the year.
In the mid-cap segment, growth stocks are down 6.5% for the year, while mid-cap value stocks are down 21.9% year to date.
Small-cap growth stocks are down 6.7% year to date, while small-cap value stocks are down 25.7% through the end of May.
All of the S&P 500 sector groups were up during May—the information technology sector led the pack with a 7.1% gain during the month. There are now four sectors up for the year: information technology (+7.3%), consumer discretionary (+2.1%), health care (+1.6%) and communication services (+0.2%). Sectors that are lagging this year include energy (–34.5%), financials (–23.4%) and industrials (–16.3%).
Since its inception in 1993, the AAII Model Shadow Stock Portfolio has a compound annual average return of 12.1%, while the Vanguard 500 Index fund and the Vanguard Small-Cap Index fund both have a gain of 9.3% per year on average over the same period. Figure 1 summarizes the long-term performance.
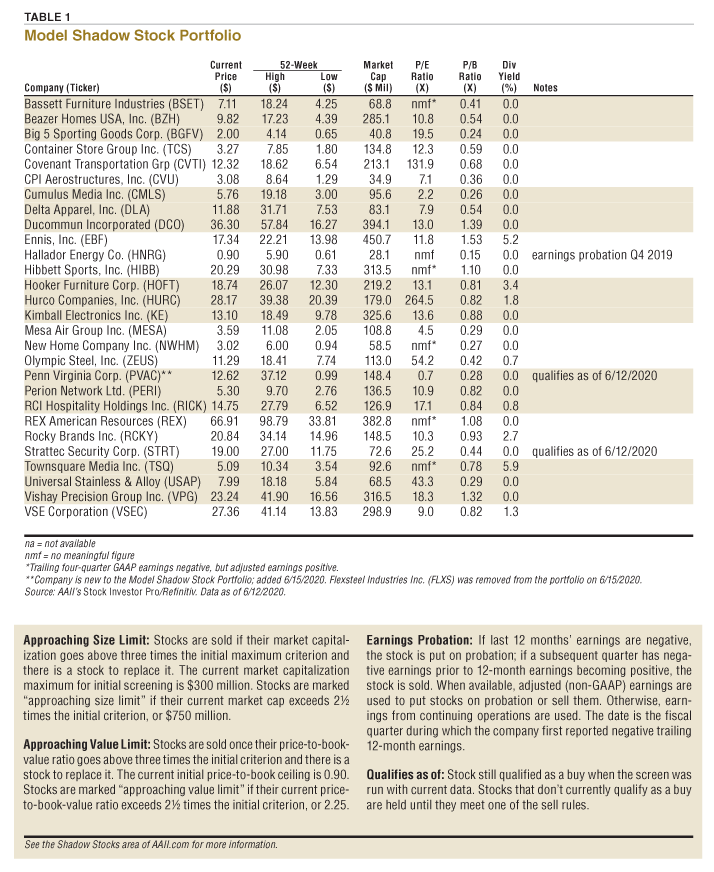
Table 1 shows all of the firms in the Model Shadow Stock Portfolio. As of June 12, 2020, Ennis Inc. (EBF) had the highest price-to-book-value (P/B) ratio in the Model Shadow Stock Portfolio. Its ratio of 1.53 is above the 0.90 maximum value used to initially determine if a stock qualifies for inclusion in the portfolio. However, stocks are not removed from the portfolio until their price-to-book-value ratio rises to three times the initial maximum value (2.70).
It may help you to think about values below 0.90 as being attractive, while values three times above the initial maximum are expensive. Allowing the price-to-book ratio to expand for stocks that you own allows your winners to run up a little, since the price-to-book ratio typically gets larger as the stock price goes up. The initial price-to-book level is adjusted over time to reflect changing market conditions, and we are examining valuation and size now for the next quarterly portfolio review.
The Model Shadow Stock Portfolio is reviewed quarterly to determine stock sales and additions, a practice put in place since the portfolio’s inception in 1993. The quarterly portfolio review cycle is tied to the standard reporting cycle of most publicly traded firms in the U.S. Companies are examined for violating the earnings, valuation, size and age rules of the Model Shadow Stock Portfolio. The detailed Model Shadow Stock Portfolio Rules with purchase and sell rules, some portfolio management rules and tips to consider when buying and selling micro-cap stocks can be found here.
The primary Model Shadow Stock Portfolio selection criteria target the intersection of the smallest 10% of domestic stocks as measured by market capitalization and the “cheapest” 10% of domestic stocks as measured by the price-to-book-value ratio. These decile breakpoints are determined by examining domestic companies that are listed on the New York Stock Exchange (NYSE).
After conducting the quarterly review of the Model Shadow Stock Portfolio, Flexsteel Industries Inc. (FLXS) was removed from the tracking portfolio and Penn Virginia Corp. (PVAC) was added to the model portfolio. Table 2 summarizes the changes.
(FLXS)Flexsteel Industries was removed because of the Model Shadow Stock Portfolio’s negative earnings rule. On April 28, 2020, the company reported an adjusted fiscal third-quarter loss of $0.66 per share, while trailing 12-month earnings remained negative.
Flexsteel is a manufacturer, importer, marketer and distributor of residential and commercial furniture products in the U.S. Product offerings include a wide variety of upholstered furniture such as sofas, loveseats, chairs, reclining and rocker-reclining chairs, swivel rockers, sofa beds, convertible bedding units, occasional tables, desks, dining tables and chairs and bedroom furniture. A featured component in most of the upholstered furniture is a unique steel drop-in seat spring from which the name “Flexsteel” is derived.
The company has serviced the hospitality, health care, senior living, government and commercial office markets, but previously announced a comprehensive restructuring plan and decided to exit its recreational vehicle, commercial office and hospitality businesses. Flexsteel will focus on three business platforms going forward: home furnishings, e-commerce and workspace solutions.
The firm’s profitability has suffered from restructuring costs as well as the impact of tariffs imposed on imports. Recently e-commerce sales have increased, but not enough to overcome the coronavirus pandemic’s impact on sales in its remaining channels.
As of June 12, eight stocks met the initial selection criteria for the Model Shadow Stock Portfolio, down from 27 stocks in the prior month. A rising stock market combined with more companies reporting negative quarterly and trailing 12-month earnings during the latest earnings reporting cycle resulted in a dramatic decline in qualifying companies. AAII members can see and research which companies are currently passing the initial selection criteria in the Shadow Stock Ideas table on AAII.com. The list of new Shadow Stock Ideas is updated daily—Tuesday through Saturday.
Looking at the price-to-book ratio and the four-week relative price strength led to the selection Penn Virginia.
Penn Virginia is an independent oil and gas company. The company is engaged in the onshore exploration, development and production of crude oil, natural gas liquids (NGLs) and natural gas. The company’s operations consist primarily of drilling unconventional horizontal development wells and operating its producing wells in the Eagle Ford Shale field in South Texas. Penn Virginia has held up better than most oil producers during the severe oil-price declines because of its hedging operations.
Based on Penn Virginia’s closing price of $12.61 on June 12, we suggest paying no more than $40.64. To calculate the maximum buy price based on the maximum desired price-to-book ratio, multiply the current book value per share ($45.16 for Penn Virginia) by the maximum price-to-book ratio to be considered for the Model Shadow Stock Portfolio (currently 0.9). The calculation is: $45.16 (DFSCX) 0.9 = $40.64.
The next quarterly review of the Model Shadow Stock Portfolio will take place at the end of August. In the meantime, you can follow the portfolio in the AAII Shadow Stocks area on AAII.com. To receive monthly email updates, along with alerts to any changes made to the portfolio, please sign up at www.aaii.com/email. ▪
Small Cap Value Investing
AAII Model Portfolios
Small Cap Value Investing

ANDREW B from NY posted over 6 years ago:
You need to log in as a registered AAII user before commenting.
Log InCreate an account