


Related

Level3 Passive Portfolio
The switch to no-commission trading of ETFs has reduced the cost for investors. Other ETF trends in 2020 include new fund rollouts and an uptick in fund assets.
by AAII Staff | February 2021
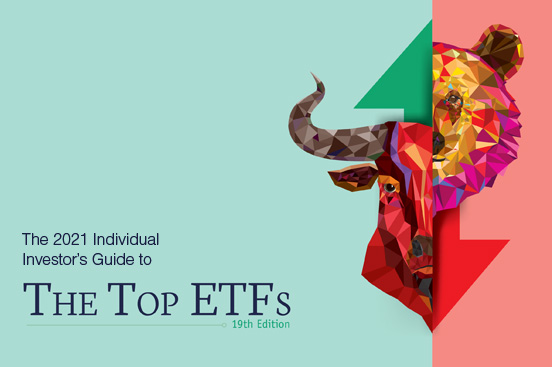
For the first time since its launch in 2003, our annual guide to exchange-traded funds (ETFs) is being published in February. As explained in this issue’s Editor’s Note, this change is being made to facilitate easier comparisons of similar mutual funds and ETFs. It also fulfills a request made by many AAII members.
Last year’s rollout of new ETF tools to AAII.com enabled this change to occur. Data on the more than 2,400 U.S. ETFs is updated monthly and is available to all AAII members.
The print and PDF versions of this guide provide data on nearly 400 ETFs of broad interest to U.S. investors. Key data on individual ETFs is displayed on a single page. Doing so allowed us to increase the number of ETFs covered as well as include a broader range of asset classes, fund groups and categories. The single page layout also makes it easier for those who prefer to print out copies.
The data displayed is similar to that shown for mutual funds, again to enable comparative analysis. You will find key data, including calendar-year and annualized returns, (based on net asset value) yield, expense ratio and portfolio turnover. Specific to ETFs is average daily trading volume. High levels of trading activity are generally associated with narrower bid/ask spreads and faster execution of trades.
Category averages and ETF grades are listed to help you quickly assess whether a particular fund’s annualized returns are above or below its peers. The category averages provide a peer-based benchmark to compare a given fund against. They allow you to quickly see if a fund is more attractive or less attractive than all other funds in a particular category.
The grades range from A to F. The scale works just like it did when you were in school, A’s are good, while F’s are bad. Each of these grades is tied to a percentile rank based on how a specific ETF compares to its category peers. An ETF’s average annual return for a given period that ranks in the top quintile (best 20%) relative to its category peers will receive a grade of A. Lower grades are assigned for lower quintile rankings. So, a grade of C means the ETF’s average annual return for a certain period was about average compared to its category peers (the 41st to 60th percentile).
In the print version of this guide, grades are provided for three-, five- and 10-year annualized returns. Online, grades are provided for additional periods as well as for category risk and expense ratio (for these two figures, the lower the rank, the higher the grade).
There is also far more detailed information provided about each ETF online. At www.aaii.com/etfs/guide, you will find details about which index an ETF tracks, its portfolio allocation, beta for equity ETFs, interest rate sensitivity (how sensitive an ETF’s returns are to changes in interest rates) for bond ETFs, inception date and whether it uses leverage or is otherwise an inverse ETF. This data is updated monthly and can be downloaded to spreadsheets: Click on the “Excel” button located on the right-hand side.
To accommodate both this guide and our Guide to the Top Mutual Funds, we moved some commentary and features previously included in the ETF guide to a separate article in this issue. This includes information about how to use the guide and return data for the major indexes.
Expanded ETF Data interactive lists of funds by category and detailed data on each fund. Spreadsheets for each asset class can be accessed under Expanded ETF Listings.
While past performance is no indication of future performance, it may attest to the quality and consistency of fund management.
Usage of exchange-traded funds continues to grow. Total assets for U.S.-listed ETFs topped $5.21 trillion as of November 2020, according to the Investment Company Institute. Assets grew by more than 22% last year.
Another way to look at growth among ETFs is to consider net issuance. Net issuance is the value of shares issued less the value of shares redeemed. During the first 11 months of 2020—the most recent data available—a net $441 billion worth of shares were issued. This compares to $270 billion for the first 11 months of 2019 based on ICI data. Net issuance was positive for domestic equity, global/international equity, bonds and commodities ETFs. Increases in net issuance signal greater demand.
The increases are being driven in part by the portfolio managers utilizing ETFs to fulfill allocation targets. Rather than holding individual securities, some managers are buying and selling ETFs to implement their strategies. The logic is that ETFs provide exposure without the need to analyze individual securities. They also reduce trading costs and time.
For individual investors, the switch to no-commission trading has reduced the cost of trading ETFs. All discount brokerage firms now offer individual investors the ability to buy any U.S.-listed ETF with $0 commissions. Other trading costs continue to apply, including bid/ask spreads and capital gain taxes. Depending on the ETF, individual investors may also pay a premium or discount to the ETF’s net asset value.
Another ongoing trend is the continuous rollout of new ETFs. While the aggregate number of ETFs appears to have stabilized, ETF sponsors continue to roll out new funds. During 2020, more than 300 new exchange-traded funds were launched.
Most of these tend to follow specialized strategies. For example, 24 options-based ETFs were launched last year. VictoryShares launched a Top Veteran Employers ETF (VTRN). This ETF targets companies that recruit, employ and help veterans in the workplace. (Good intent does not necessarily equate to a good investment strategy.) The North Shore Dual Share Class ETF (DUAL) invests in U.S. companies that have dual share classes. (We haven’t seen research supporting such an approach.)
Most of these ETFs have failed to gain any significant interest among investors. The median asset size of the ETFs launched last year is a puny $17 million. A common rule is that ETFs with assets of less than $100 million are at higher risk of being closed.
Only one ETF launched in 2020 attracted more than $1 billion in assets: JPMorgan BetaBuilders US Mid Cap Equity ETF  (BBMC). The ETF seeks to invest in mid-cap stocks with high levels of float-adjusted market capitalization. Such a strategy considers not only the size of a company but also how many of its shares are readily available for trading in the market.
As of year-end 2020, there were 501 exchange-traded funds not designated as being “index” ETFs by Morningstar, which provides our data. The median assets under management for those ETFs is $52 million. Only one-third of all non-index ETFs have attracted $100 million or more in assets.
There are some exceptions. Twenty-eight actively managed ETFs have total assets in excess of $1 billion. Twenty of these 28 are bond ETFs. One of the oldest actively managed ETFs, PIMCO Enhanced Short Maturity Active (MINT), is the third largest at $14.3 billion in assets. It is surpassed in size within the fixed-income asset class by JPMorgan Ultra-Short Income (JPST), which has $15.6 billion in assets.
The largest actively managed ETF is ARK Innovation ETF (ARKK), with nearly $17.7 billion in assets. ARK Innovation is also one of last year’s best performers, as can be seen in Table 2. The thematic ETF targets companies it defines as being engaged in “disruptive innovation.” It holds a concentrated portfolio, with its top 10 holdings accounting for more than 50% of the total portfolio. ETFs with highly concentrated portfolios expose investors to more security-specific risk. A drop in one or two top holdings could cause the entire ETF’s performance to suffer.
Vanguard and iShares continue to be the largest players in the ETF space. BlackRock’s iShares ETFs manage more than $2.0 trillion of total assets. Vanguard’s ETFs have total assets in excess of $1.5 trillion.
This concentration of assets can be seen in the list of the largest ETFs (Table 1). The two firms account for 41 of the 50 largest ETFs.
Notably, the largest ETF is also the oldest. SPDR S&P 500 ETF Trust (SPY) has assets of $329 billion. It was the first ETF ever launched (1993). Despite having a first-mover advantage, State Street Global Advisors’ SPDRs unit ranks behind BlackRock’s iShares and Vanguard ETFs in total size, with approximately $845 billion in total assets.
Exchange-traded funds appearing in this guide are listed on U.S exchanges. The following explains the criteria we used to screen for and then identify which ETFs to include in the print and the PDF versions of this guide.
The starting point for determining which categories to include were the ETF groups matching our Asset Allocation Models. The stock and bond ETFs comprising these groups are also most frequently in individual investors’ portfolios. We then expanded the list of ETF categories to cover those of interest to a large number of investors. This latter group includes sector ETFs, high-yield bond ETFs and allocation ETFs. To the extent possible, we included categories similar to those appearing in the mutual fund guide.
ETFs were generally required to have three full years of data to be included in Table 4. This requirement ensures that there is a performance record of significant length and that all performance measures can be calculated. Exceptions were made for certain ETFs whose size makes them of interest to a large number of investors.
The requirement for three years of return data was loosened for the listings of the best- and worst-performing ETFs (Tables 2 and 3) to provide a more direct comparison with our Quarterly ETF Update, which will be included in the May, August and November issues of the AAII Journal.
Large-cap ETFs were generally required to have at least $1 billion in assets. All other included ETFs were generally required to have at least $750 million in assets. These size requirements were loosened from a year ago to include more ETFs. The size requirement was loosened for the top and bottom performers (Tables 2 and 3).
Due to the generally lower cost of ETFs, a cap on expense ratios was not used. Very few of the ETFs appearing in the print and PDF versions of this guide have expense ratios of 0.70% or higher.
To include a larger number of ETFs, performance requirements were not applied. The majority of the ETFs appearing in this guide have three-year annualized return grades of C or better. Such ETFs either outperformed their category peers or have three-year annualized returns similar to their peers.
Only those ETFs that are of general interest to exchange-traded fund investors are included.
AAII members who would like additional details on the ETFs included in the print version of this guide or who would like to see the ETFs that did not appear in the print version can access this information at www.aaii.com/etf-guide, where data on more than 2,400 exchange-traded funds can be found.
Additional analysis can be conducted with our Compare ETFs tool. You can use it to compare and contrast return, risk and turnover information for two or more ETFs. You can also track the ETFs you own or are most interested in with My Portfolio. ▪
Level3 Passive Portfolio

Trading Strategies

Exchange-Traded Funds

J G from KY posted over 5 years ago:
RAY H from NC posted over 5 years ago:
ANNIE P from IL posted over 5 years ago:
R M from NY posted over 5 years ago:
CORRINE T from CO posted over 5 years ago:
J M from NJ posted over 5 years ago:
J G from KY posted over 5 years ago:
CHAS R from IL posted over 5 years ago:
Luis M from CA posted over 5 years ago:
HYAM S from VT posted over 5 years ago:
JORGE G from CA posted over 5 years ago:
CHARLES R from IL posted over 5 years ago:
You need to log in as a registered AAII user before commenting.
Log InCreate an account