


Related

PRISM Wealth-Building Process
Relatively few investors understand all the most important ways they should look at performance.
by Paul Merriman | April 2021
Paul Merriman leads a class in AAII's new Essential Investing Video Course. Go to https://www.aaii.com/ves for more information and to subscribe.
The quest for performance drives most things that investors do and expect. Performance sometimes makes investors despair or get angry. Sometimes performance makes them giddy with happiness.
But relatively few investors understand all the most important ways they should look at performance.
Imagine you are wandering in the woods at night, and you happen upon a lighted cabin with unshaded windows. You’re not a peeping tom, but you’re naturally curious. The view through one window gives you some information, but you’ll get a much better picture of what’s going on if you walk around and look through every window.
In this article, I look at investment performance through seven windows, each offering a slightly different view. Some of this will be familiar, but some will be new and perhaps even surprise you.
Information on long-term returns is more reliable and useful than focusing on short-term returns. I will sometimes talk of a “lifetime return,” and I should start by telling you what I mean.
Your lifetime return, as I’ll use the phrase, is the total of all the money you withdraw from your portfolio when you’re retired, plus whatever is left over for your heirs.
Because it’s impossible to predict how long any given individual will live, I’ll make these three assumptions:
Under those assumptions, even at age 65 you have a long-term investment horizon—30 years.
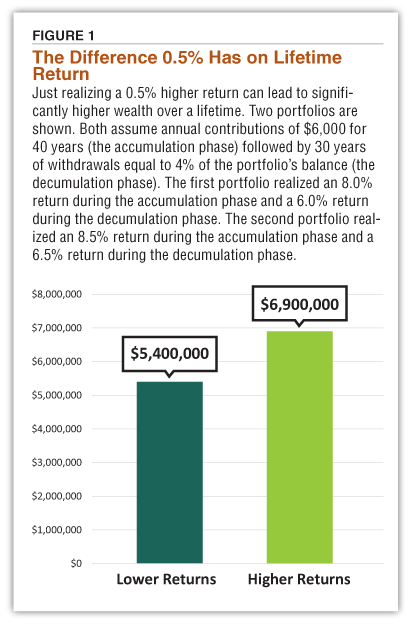
The first thing we see through this window is that small changes have large consequences. I have argued that a difference of only 0.5% in returns can be worth $1 million over a lifetime of accumulating assets and then withdrawing them during retirement.
Here’s an example of how such a small change in return can affect a lifetime return as I have described it.
Imagine you invest $6,000 a year from age 25 to 65, earning a compound return of 8%. When you retire, you adopt a more conservative asset mix that earns 6%. Over the next 30 years, you withdraw a total of $2.6 million. At age 95, your account is worth $2.8 million. Your lifetime return is thus $5.4 million.
But what if your portfolio earned an extra 0.5% over all those years?
In that case, with 40 years at 8.5% and 30 years at 6.5%, your withdrawals would total $3.2 million, and your portfolio would be worth $3.7 million. That would boost your lifetime return to $6.9 million (Figure 1).
The difference: $1.5 million, all of it the result of that “little extra” 0.5% return.
Now think about the implications of owning stocks versus bonds. In very general terms, the long-term return of stocks has been 10%; the long-term return of bonds has been 5%.
That difference is 10 times as great as the additional 0.5% that can make an enormous impact on long-term results.
As you certainly understand, most investors need some bonds in their portfolios to mitigate the ups and downs of the stock market. But every 10% of your portfolio that you shift from stocks to bonds, based on real returns from 1970 through 2020, decreases your long-term return by about 0.5%.
That’s why getting just the right mix of stocks and bonds—a topic beyond the scope of this article—is so important.
Through this “time matters” window, we also see the enormous difference that comes from starting to save money earlier instead of waiting until later. Here’s an example from my new book “We’re Talking Millions! 12 Simple Ways to Supercharge Your Retirement” (The Merriman Financial Education Foundation, 2020).
Imagine you save $5,000 a year every year from age 21 to age 65 and that you get a steady return of 8%. The $50,000 you save in the first decade (your 20s) grows to $1,070,940 by your 65th birthday. Your second $50,000 (what you save in your 30s) grows to $496,050, and your third $50,000 (your savings in your 40s) grows to only $229,769.
At age 65, you wind up with $1.9 million; more than half of it is the result of that first decade of savings.
Here’s something else we see through this window: Longer holding times mean higher likelihood of gains. Measured daily, 55% of the S&P 500 index’s returns are likely to be positive. Monthly returns for the index are 64% positive. The percentage of positive returns rises to 70% for one-year periods and 87% for five-year periods.
I have spent untold hours over the past half century—along with many other authors, educators and advisers—teaching investors how to put all the probabilities in their favor by avoiding common mistakes, controlling asset choices, minimizing expenses and tax consequences and controlling their emotions and their behavior. Yet in spite of all these efforts, luck plays a larger part in our lifetime success (or lack of it) than we sometimes like to admit.
In 2017, I interviewed John Bogle, who acknowledged that luck was extremely important to his own success. It was 1976 when The Vanguard Group introduced the company’s flagship fund, the Vanguard 500 Index Fund  (VFINX). That was just in time to capture most of the index’s amazing compound return of over 17% from 1975 through 1999.
John Bogle understood that if he had started that fund in 2000, just before two brutal bear markets, that fund would not have attracted many converts. As it turned out, the S&P 500 returned less than 7% in the first 21 years of this century.
This reflects the luck of when you start investing. Start at the beginning of a long bull market, and you may feel that you’re brilliant (and maybe your spouse will as well). But start at the end of a bull market, for instance in the final months of 1999, and you won’t feel brilliant or successful at all.
Then there’s the pure dumb luck of being born in the right place.
I knew a woman who invested $10,000 in Microsoft stock when it was first offered to the public. Her motivation? She routinely drove past the company’s offices in a Seattle suburb on her way to work and thought it would be cool to invest in the bright young folks who were running that company. (By the way, this woman held onto that stock through some significant downturns and made a great deal of money.)
Coca-Cola had the same effect on many investors in Atlanta, as did Warren Buffett’s Berkshire Hathaway in Omaha.
On the other side of the coin, in the 1970s lots of people in the Boston area believed fervently in Polaroid. Similar stories involve Washington Mutual in Seattle and Enron in Houston. They weren’t so lucky.
We think you’d like this related webinar! The Individual Investor Show: New Ways to View Performance, Socially Responsible Funds + Lessons From Investing Pros
This isn’t an article about diversification. But it can have an enormous impact on performance. More than you might expect.
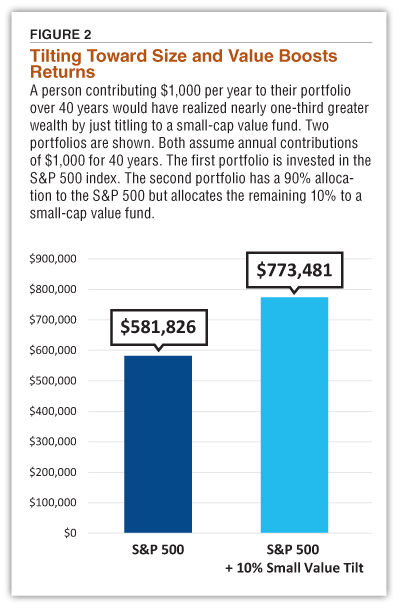
Here’s an example from the book I mentioned earlier. Imagine you’re young and you can commit to investing $1,000 a year for 40 years.
You could invest all your money in the S&P 500. Based on the average 40-year return of that index from 1928 through 2019 (11%), after 40 years, you’d have $581,826—a very nice result from the $40,000 that you saved over the years.
Alternatively, if you allocated just 10% of each annual investment ($100 a year) to a small-cap value fund, putting the other 90% in the S&P 500, your portfolio would be worth $773,481 after 40 years—about 30% more. The extra dollars from doing something different with only $100 a year would be nearly five times as much as the total of all the money that you put in over 40 years (Figure 2).
Here’s another example, based on actual historical returns, not just average ones. An initial investment of $100,000 in the S&P 500 in 1970 would have grown to nearly $18 million by the end of 2020. Had you shifted just 10% of that into U.S. large-cap value stocks, at the end of 2020 you would have had $19.4 million.
Tilting your portfolio toward value—as I described in the June 2017 AAII Journal (“Power Your Portfolio With Value”)—resulted in wealth that was nearly 15 times your entire initial investment. And the benefit in this case resulted from changing only 10% of your portfolio.
That includes most of the figures in this article. My previous example started in 1970 and showed how $100,000 could have turned into $19.4 million.
That sounds really good. But there’s always an elephant in the room: inflation. In 2021, to buy what $100,000 would buy in 1970, you’d need about $674,180. Granted, $19.4 million is a lot more than that. But in 1970 dollars, you would wind up with about $2.8 million. That’s about 28 times what you started with, not 194 times.
From 1970 through 1989, the reported return for the S&P 500 was 11.6%. After actual inflation, the “real” return was much less impressive: about 5%. Though we can’t know ahead of time what inflation will be, we can be sure it will eat away at investment returns.
Another source of misleading returns can be found among load funds. For example, data from Morningstar recently showed that the popular American Funds Growth Fund of America Class A (AGTHX) had a 10-year trailing performance of 14.94%. Do the math and you might expect that after 10 years, an initial $1,000 investment would be worth $4,025.
But no. You thought you invested $1,000, but only $942.50 of your money actually made it into the fund’s portfolio. The rest, $57.50, was a sales commission. After 10 years, you would have $3,793.
Few investors would bother to do the calculations, but that $57.50 sales commission actually cost you $232 over that 10-year period.
That means your actual return on $1,000 was 14.26%. Granted, that’s a very good return. But it’s not the 14.94% that the fund reported to the government and Morningstar reported to you.
The difference is greater than the 0.5% that can be worth $1 million in a lifetime I mentioned earlier. Buying a load fund, in other words, is an often-overlooked $1 million mistake.
Up to $250,000, bank deposits are guaranteed by the FDIC. There is no risk of losing your savings, but there is a huge difference in what various banks will pay you to park your dollars with them.
Some credit unions and banks pay 0.01% interest on savings. At that rate, you’d earn a whopping $1 a year for having $10,000 in savings.
Certificates of deposit (CDs) pay more. But the rates vary quite a bit. In February 2021, Bankrate.com reported the average one-year CD rate as being 0.29%. It did identify a couple of credit unions offering rates of 0.65%, or $65, on a $10,000 deposit.
The difference between $65 and $29 isn’t much. But it’s a very rare example of getting paid twice as much—or half as much, if you prefer—with no change at all in risk.
Usually, investors get paid to take risks. In this case, they get paid for being willing to shop around.
That may surprise you. Even I have described dollar-cost averaging as “the only free lunch on Wall Street.” But actually, it’s not.
For investors accumulating assets, investing the same number of dollars every month over time is a great strategy. When prices are lower, you buy more shares. When prices are higher, you buy fewer shares. It’s all automatic, and your average cost per share is lower than the average of all the prices you pay.
But here’s where the picture sours a bit: Many retirees withdraw regular amounts every month or every year. When prices are high, they sell fewer shares; when prices are low, they sell more shares. The average price they receive per share is lower than the average of all the prices. In one sense, retirees are the ones making dollar-cost averaging work for young investors.
Fortunately, it’s not as bad as it sounds. If you practice dollar-cost averaging over a lifetime of accumulation and then distribution, it will do you more good in your early years than harm in your later years.
If all your investments are in individual retirement accounts (IRAs) and/or defined-contribution 401(k) accounts, this won’t apply to you. This isn’t the case for the many people who keep some of their money in taxable accounts.
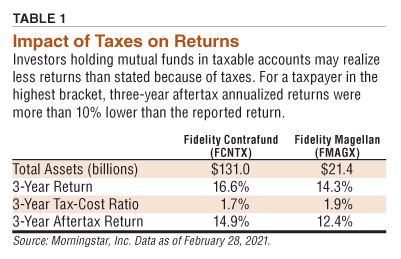
Depending on your tax bracket, taxes can reduce what might seem like a good return into a not-so-good one.
On the surface, it’s relatively simple to compare the aftertax returns of investments. The information is available online at AAII.com. Enter the fund ticker symbol. On the mutual fund evaluator page, scroll down about halfway and look for a number identified as the three-year tax-cost ratio. If you’re in the top tax bracket, subtract that number from the three-year return; the result is your aftertax return.
Table 1 compares two large actively managed Fidelity Funds: Magellan (FMAGX) and Contrafund (FCNTX).
Investors with taxable accounts should be especially inclined toward index funds. In four major U.S. asset classes, large-cap blend (the S&P 500), large-cap value, small-cap blend and small-cap value, the average tax-cost ratio of Vanguard’s index funds was 0.50%, versus 1.49% for the average of actively managed funds in those four asset classes.
To get the best performance to meet your needs, I suggest you adopt a long-term view. Do your best to ignore short-term and medium-term swings in the market, or at least don’t let them drive your decisions.
Diversify widely. Adopt a buy-and-hold attitude. Be patient. Make sure your goals and expectations are reasonable. Avoid load funds. Avoid active management. Keep your expenses low.
You’ve probably heard those things over and over.
PRISM Wealth-Building Process
Portfolio Strategies
AAII InvestoGraphic

Don J from CO posted over 5 years ago:
GREGORY D from TN posted over 5 years ago:
VAIDY B from CAN posted over 5 years ago:
KAYE L from NE posted over 5 years ago:
ROBERT A from NC posted over 5 years ago:
TOM E from CA posted over 5 years ago:
ANDREW M from TX posted over 5 years ago:
BARRY J from TX posted over 5 years ago:
John M from MI posted over 5 years ago:
JEAN H from IL posted over 5 years ago:
RONALDO J from MD posted over 5 years ago:
KAYE L from NE posted over 5 years ago:
You need to log in as a registered AAII user before commenting.
Log InCreate an account