


Related

Industry Focus
Technology mutual funds and ETFs are highly thematic and come in many flavors. In addition, what counts as “technology” varies by fund.

Riding a seesaw is analogous to the performance of the technology sector in 2022 and 2023. Of all mutual fund and exchange-traded fund (ETF) equity sectors, there has been no bigger personality in the room—giving even the most introverted partygoers plenty to chew on while sipping on their cocktails. As we noted in our 2023 annual fund guides, mutual funds focused on the technology sector lost an average of 37.2% in 2022, while technology ETFs lost 37.6% on average.
The year 2023 has been quite the opposite. The technology mutual fund category had a year-to-date gain of 41.2% as of November 30, 2023. The comparable ETF group was up 31.5% year to date.
Thinking or talking about technology these days often brings up the so-called Magnificent Seven: Alphabet Inc.  (GOOGL), Amazon.com Inc. (AMZN), Apple Inc. (AAPL), Meta Platforms Inc. (META), Microsoft Corp. (MSFT), Nvidia Corp. (NVDA) and Tesla Inc. (TSLA). These technology stocks are currently the seven largest companies in the S&P 500 index. As of December 8, 2023, the top 10 companies in the S&P 500 accounted for 32.9% of its total market capitalization and 21.2% of its earnings, according to J.P. Morgan Asset Management. Many individual investors have exposure to the Magnificent Seven stocks because they are invested in widely held mutual funds and ETFs that track the performance of the S&P 500.
Tech carries a big stick and the lines have blurred around the definition of what technology is. Therefore, our survey of technology mutual funds and ETFs compares and contrasts them by their specific type.
A handful of technology themes have been headliners in the news recently. Companies that make semiconductors or produce equipment to make semiconductors are in the spotlight. Spending on semiconductor manufacturing equipment is growing rapidly. This is driven by new chip designs to support artificial intelligence (AI) and the reshoring of semiconductor production by developed countries to help create resilient supply chains. Case in point, U.S. companies have announced an investment of over $166 billion in semiconductors and electronics since the CHIPS and Science Act was signed into law in 2022.
AI was the catchphrase of 2023, eliciting both excitement and fear. Some envisioned a modern-day “Westworld,” while others experimented with how OpenAI’s ChatGPT could create efficiencies and improve the quality of their work. Companies not focused on technology eagerly worked AI into their quarterly earnings calls to prove they were modern and plugged in. While the question still looms of how ChatGPT and similar technologies will fit into our lives or affect our livelihoods, the initial hype of AI is starting to fade. Investors are now looking for companies to start efficiently implementing AI in their business methodologies to foster growth. FactSet recently reported that 16% fewer S&P 500 companies mentioned AI during their earnings calls for third-quarter 2023 (152) than for second-quarter 2023 (180).
Cybersecurity is another area that has drawn attention. According to Cybersecurity Ventures, projections indicate that worldwide cybercrime costs are anticipated to total a staggering $9.5 trillion in 2024 and $10.5 trillion by 2025. Thus, there is strong demand for this flavor of technology products.
We used the A+ Investor mutual fund and ETF screeners to filter on equity mutual funds and ETFs in the technology sector. We further grouped these into broad-based technology and other technology groups including internet, semiconductors, software, cybersecurity and AI. The “other” category comprises those mutual funds and ETFs that did not cleanly fit into one of the aforementioned categories.
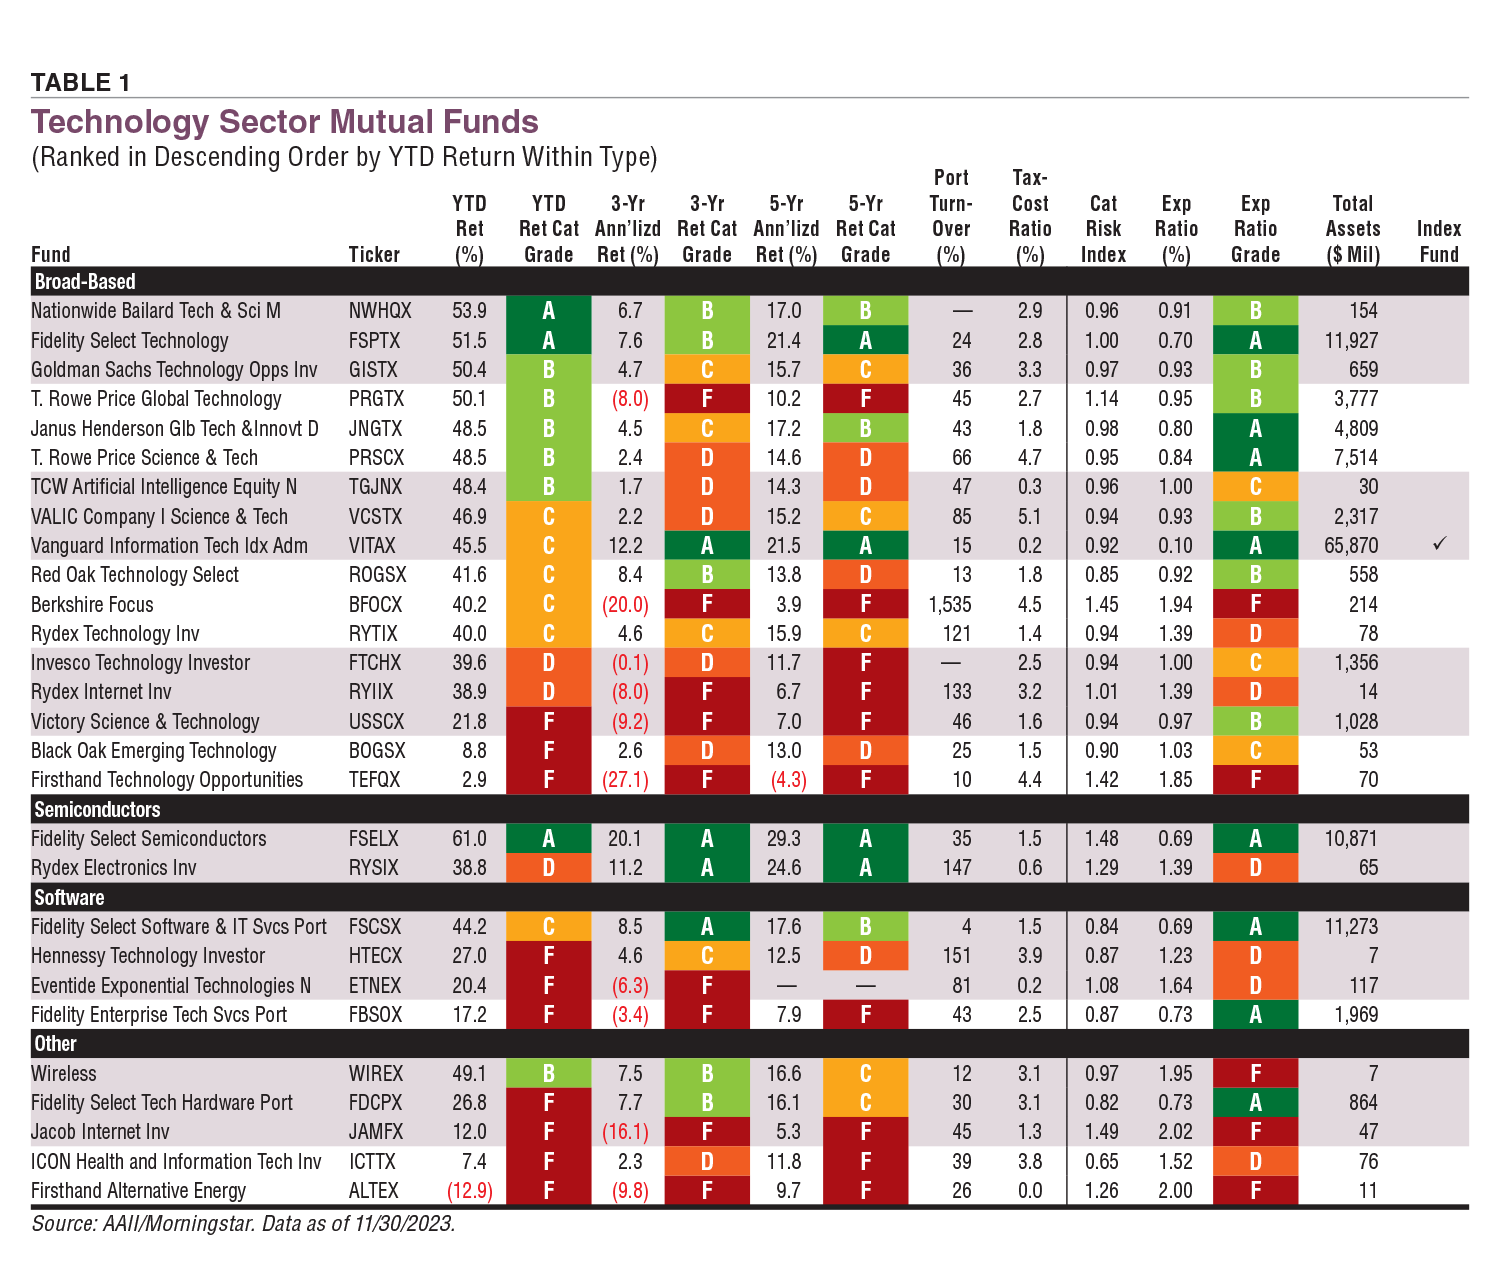
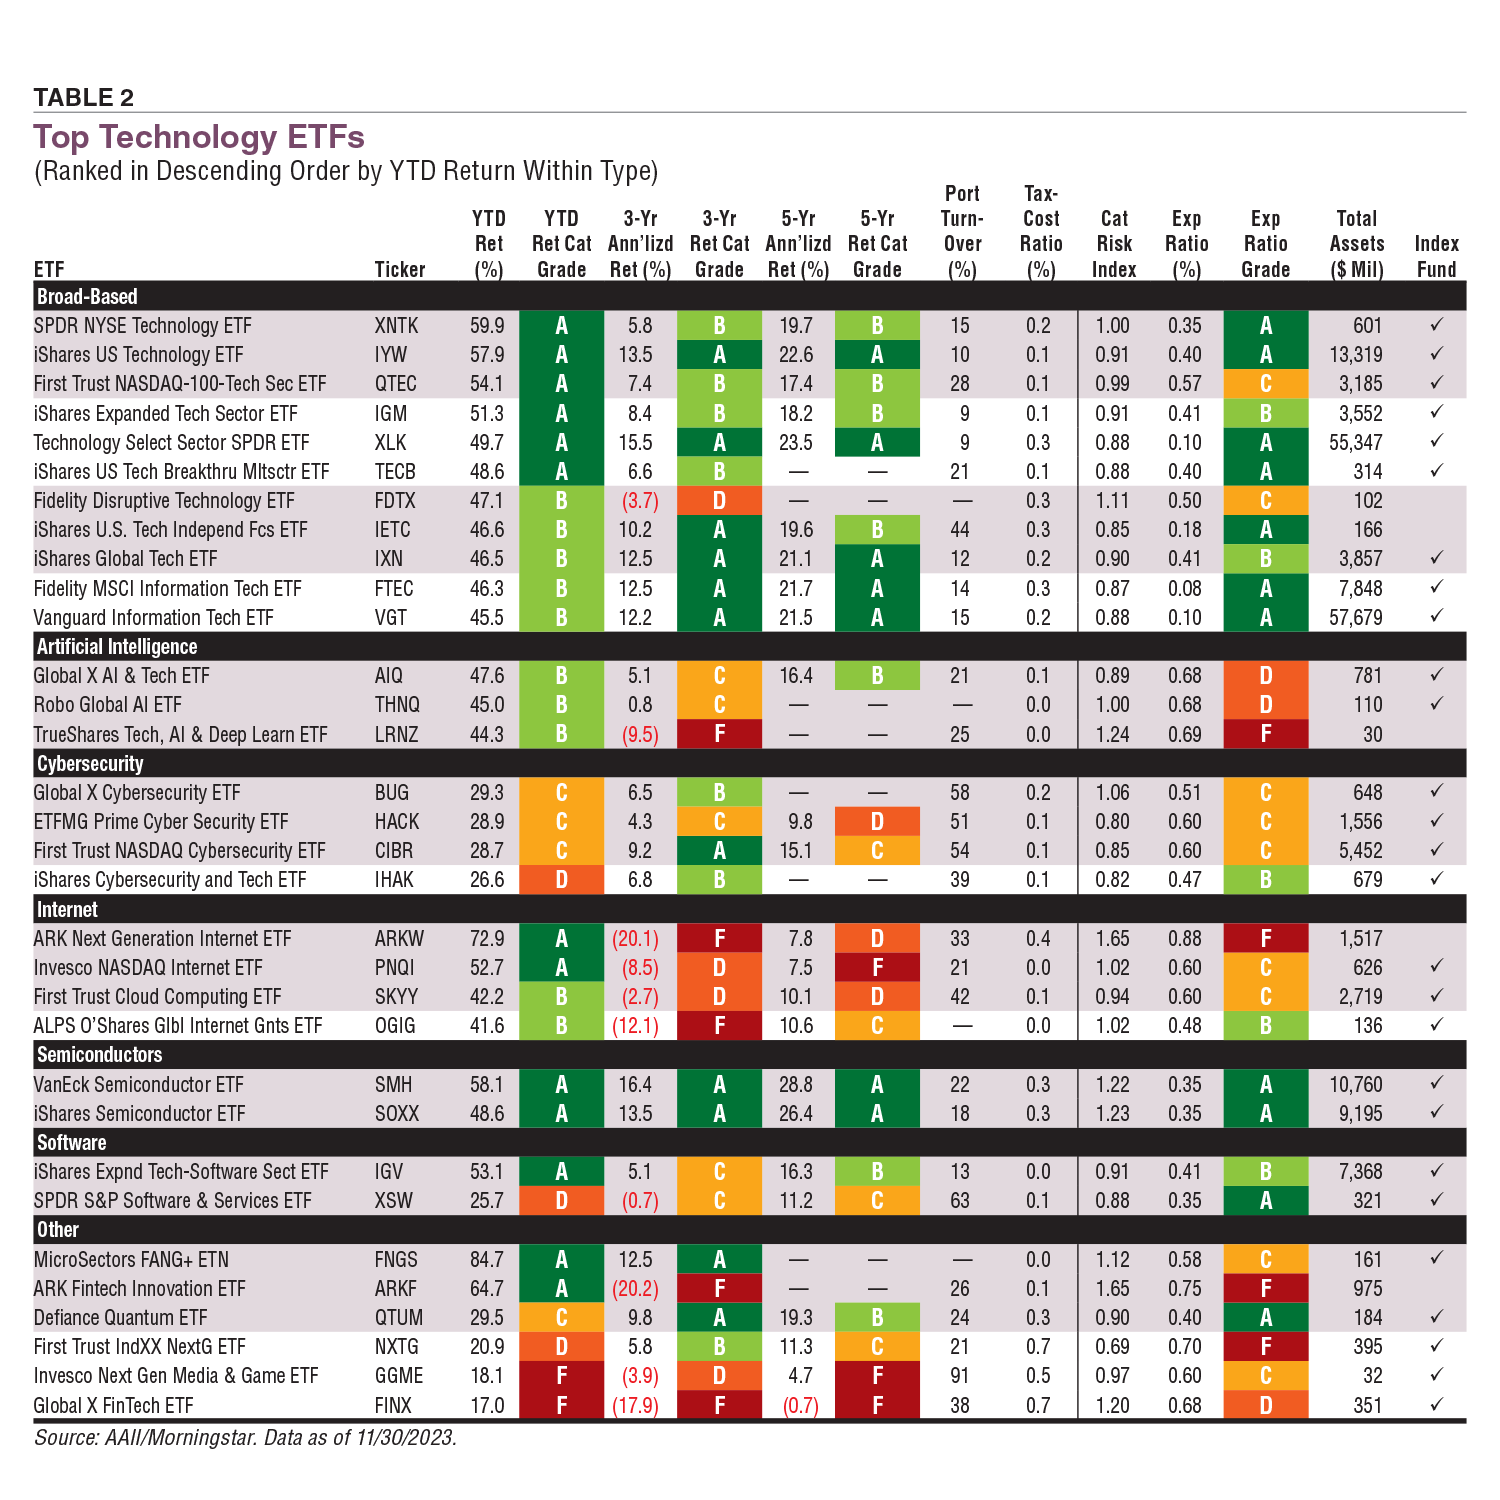
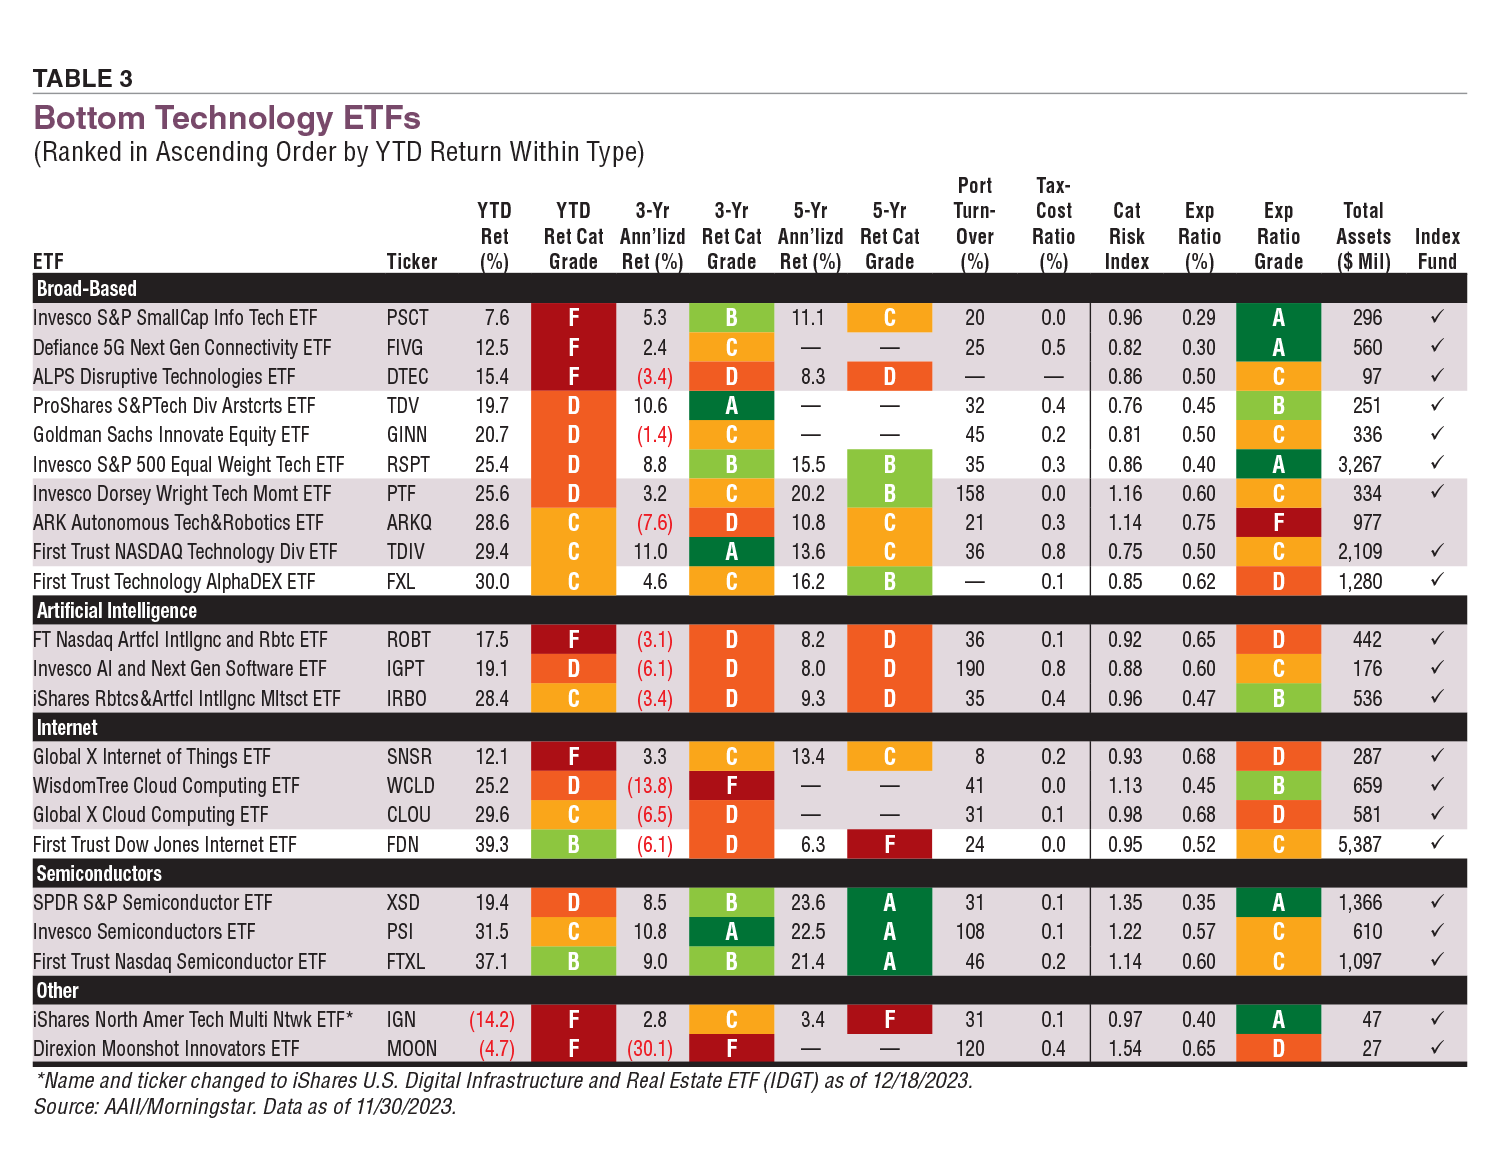
With only 28 mutual funds identified as technology, Table 1 shows the entire list. The number of ETFs is larger and the types are more nuanced. We started with around 75 ETFs and removed any that did not have a three-year performance record. Top- and bottom-performing ETFs are shown in Tables 2 and 3, respectively. Ranked by year-to-date performance within the categories, the three tables also display three- and five-year returns to provide a complete picture. A+ Investor Grades are shown with all performance metrics.
Given AAII members’ desire to minimize taxes, we highlight both the tax-cost ratio and portfolio turnover. The tax-cost ratio is a three-year number that measures how much a fund’s annualized return is reduced by the taxes investors pay on distributions. It provides additional information that is not available from reviewing aftertax returns alone. Portfolio turnover measures how frequently assets within a fund are bought and sold by fund managers. It is calculated by taking the lesser of the total amount of new securities purchased or the number of securities sold divided by the net asset value of a fund and is reported over a 12-month period. The tax-cost ratio and portfolio turnover can be especially important when considering actively managed funds, but even for index funds taxes and transactions can add to investment expenses.
The tables also show the category risk index. This measure compares the standard deviation of returns for individual funds with that of peers from the same category; it is based on monthly returns for the past three years. The average value is 1.00. Funds with a higher value have experienced more volatile returns than their peers, while funds with a lower value have experienced less relative volatility. Tables also report the expense ratio: Simply put, the higher the expense ratio, the greater return a fund must earn just to match the performance of a lower-cost peer.
Because the mutual funds and ETFs that are categorized as technology have differing themes and objectives, we include total assets so subscribers can see the level of investment in each fund.
Only one of the technology mutual funds is classified an index fund; all the rest in Table 1 are actively managed.
Year-to-date returns in the broad-based category range from 53.9% to 2.9%. The Nationwide Bailard Technology & Science Class M fund (NWHQX) was the top broad-based performer. The fund’s top 10 holdings include six of the Magnificent Seven: Alphabet, Amazon, Apple, Meta Platforms, Microsoft and Nvidia. Its year-to-date return earned an A+ Investor Grade of A. The fund also has A+ Investor Grades of B for the three- and five-year return periods with annualized gains of 6.7% and 17.0%, respectively. A portfolio turnover metric was not available for the fund, but its tax-cost ratio is higher than the median of 2.5% and average of 2.4% for all funds in Table 1.
Download the Excel Spreadsheet for Table 1.
The one index fund, Vanguard Information Technology Index Admiral fund (VITAX), received an A+ Investor Grade of C for its 45.5% year-to-date return. The fact that this impressive return is only about average for the broad-based category shows just how well technology mutual funds have performed in 2023. A peek at the Vanguard fund reveals that Apple and Microsoft together account for 43% of its portfolio. The fund has the lowest expense ratio in the table at 0.10%, which equates to an A+ Investor Grade of A. This is a broad-based and widely held fund with the most assets of all in the technology sector. Investors can also purchase this same fund as an ETF, Vanguard Information Technology Index ETF (VGT), per Vanguard’s dual-share class structure.
The best semiconductor tech mutual fund was also the top performer in Table 1, Fidelity Select Semiconductors (FSELX), with a year-to-date return of 61.0%, earning an A+ Investor Grade of A. It also has a grade of A for the three- and five-year periods, with returns of 20.1% and 29.3%, respectively. The fund’s expense ratio of 0.69% equates to an A+ Investor Grade of A. Its portfolio turnover of 35% is below the median of 43% and average of 110%. The tax-cost ratio is also favorable at 1.5%.
The Wireless fund (WIREX) is a good example of the traditional definition of technology being turned on its ear. The fund invests in companies involved in manufacturing and/or providing communication equipment, software and programming, computer hardware, peripherals, storage devices, semiconductors and data networking for the wireless industry. It is narrowly focused, with only 23 holdings and $7.0 million assets under management. Its year-to-date, three-year and five-year returns are 49.1%, 7.5% and 16.6%, respectively, which equate to A+ Investor Grades of B, B and C.
An exchange-traded note (ETN) from the “other” category takes the highest-performing accolades among the ETFs for year-to-date performance. The MicroSectors FANG+ ETN (FNGS) clocked an 84.7% return for the year so far, earning it an A+ Investor Grade of A. It also earned an A for the three-year period with its 12.5% annualized return. The ETN’s strategy is unique in that it is passively managed and seeks to link its return to the performance of the gross total-return version of the NYSE FANG+ index. This is currently an eight-component index with well-known companies such as Snowflake Inc. (SNOW), Broadcom Inc. (AVGO), Netflix Inc. (NFLX) and five of the Magnificent Seven companies.
The ARK Next Generation Internet ETF (ARKW) is the second-best year-to-date ETF performer with a 72.9% return and an A+ Investor Grade of A. It has had an uneven performance record with annualized returns of –20.1% and 7.8% over the three- and five-year periods, equating to A+ Investor Grades of F and D, respectively. Part of the internet category, it focuses on next-generation internet holdings. Its largest holding is Coinbase Global Inc. (COIN), the leading cryptocurrency exchange platform in the U.S. ARK Next Generation Internet is an actively managed ETF, which is reflected in its higher-than-category average expense ratio of 0.88%. The comparatively high cost earns the ETF an A+ Investor Grade of F. This ETF ties with another ARK family ETF, ARK Fintech Innovation ETF (ARKF), for the highest category risk index of 1.65. Five of the ETFs listed in Table 2 are actively managed.
Download the Excel spreadsheet for Table 2.
In the broad-based category, the SPDR NYSE Technology ETF (XNTK) was the top performer for 2023 so far, with year-to-date performance of 59.9%. This is equivalent to an A+ Investor Grade of A. Year-to-date performance for broad-based ETFs ranged from 59.9% to 7.6%. The Invesco S&P SmallCap Info Tech ETF (PSCT) took the last spot, with its 7.6% year-to-date return earning an A+ Investor Grade of F. Bigger was better in 2023 and small-cap stocks, which make up the index that this ETF tracks, generally lagged their larger peers.
A standout semiconductor ETF is the VanEck Semiconductor ETF (SMH). It has earned A+ Investor Grades of A across all three time periods shown, with returns of 58.1%, 16.4% and 28.8%, respectively. This is below the performance of the Fidelity Select Semiconductors mutual fund, but the ETF’s expense ratio of 0.35% is nearly half that of the Fidelity fund (0.69%).
Download the Excel spreadsheet for Table 3.
The weakest ETF was the iShares North American Tech-Multimedia Networking ETF (IGN) with a –14.2% year-to-date return, which is equivalent to an A+ Investor Grade of F. Just before we went to press, this ETF changed its name and ticker symbol to the iShares U.S. Digital Infrastructure and Real Estate ETF (IDGT). It also changed the index it follows to the S&P Data Center, Tower REIT and Communications Equipment index. The ETF’s expense ratio rose slightly from 0.40% to 0.41%. Anytime there is a change like this, past returns will likely be less reflective of future performance than would be the case if the fund’s strategy had not changed.
As you can see, there are many flavors of technology that investors should keep in mind as they consider tech-focused mutual funds and ETFs for their portfolios. Technology funds are highly thematic. In the case of ETFs, some even add additional wrinkles by utilizing alternative weighting—such as the Invesco S&P 500 Equal Weight Technology ETF (RSPT)—or seek technology funds that pay dividends—like the First Trust NASDAQ Technology Dividend Index ETF (TDIV).
In researching this article, I found technology funds and ETFs that had incorporated a dose of health care by including insurers due to their information technology capabilities. Fintech and internet seemed blurred in some cases. The ARK Autonomous Technology & Robotics ETF (ARKQ) includes both farm equipment manufacturer Deere & Co. (DE) and construction equipment manufacturer Komatsu Ltd. (KMTUY) in its top 10 holdings. This is likely a bet on the automation of such activities.
Therefore, it pays to really open the hood on technology mutual funds and ETFs to look at their objectives and their holdings along with how their returns and expenses compare to their peers. The definition of technology and how technology companies are incorporated into mutual funds and ETFs will continue to evolve.
As a reminder, investors can research funds further at AAII.com. Data for more than 23,000 mutual funds and 3,200 ETFs is updated monthly and available to all AAII members. To access our fund guides, screens of top performers, comparison tools and more, visit www.aaii.com/funds and www.aaii.com/etfs.
Industry Focus

Portfolio Strategies


ROBERT A from NC posted over 2 years ago:
STEVEN P from MI posted over 2 years ago:
DAVID H from NV posted over 2 years ago:
CRAIG L from MI posted over 2 years ago:
BILL N from FL posted over 2 years ago:
Joseph B from MI posted over 2 years ago:
BARRY J from TX posted over 2 years ago:
BARRY J from TX posted over 2 years ago:
David B from UT posted over 2 years ago:
ROBERT B from VT posted over 2 years ago:
You need to log in as a registered AAII user before commenting.
Log InCreate an account