

There are three benefits to individual investors of knowing how to use the Treasury bond yield curve.
The first is the yield curve’s function as an identifier of changes in the economy. This was illustrated by its brief inversion in March as the market reacted to the Federal Reserve’s interest rate plans and their wider economic implications.
The second benefit is that it is free to the public, with data published on the Treasury Department’s website.
The third benefit is the ease of understanding what the curve is telling investors, without the need to perform additional math.
What Is a Normal Yield Curve?
Typically, the generic use of “the yield curve” references the plotting of the yields of U.S. Treasury fixed-rate bills, notes and bonds for a given day.
But a yield curve can be plotted for any fixed-income issue. A yield curve could be used to compare debentures (unsecured bonds) categorized by credit quality or type of debenture, for example.
The basic yield curve illustrates the interest rate spread for a category of bonds. Bonds with different maturity dates trade at yields different from each other due to their differing interest rates.
The longer a bond’s time to maturity, the higher its interest rate is expected to be in order to provide compensation for the period of time the investor’s capital is being held onto as a loan to the issuer. The higher interest rate of the issue accounts for the loss of purchasing power due to the eroding effects of inflation, the chance that interest rates will rise in the future and the risk that the issuer may default. The longer an investor has to wait, the more potential there is for their investment to lose value by one of these scenarios.
The yield curve depends on three components.
Coupon Rate
First is the interest rate, or coupon, which is the fixed rate the bond will pay until maturity as compensation for the investor deferring their spending. A $1,000 bond with a 3% yield will pay $30 ($1000*3%=$30) annually in interest. This component is a function of the supply and demand for bonds.
Premium for Inflation
The second component is the premium for the expected rate of inflation. With the normal expectation that inflation will lead to higher prices on goods and services over time, longer-term bonds will pay a higher interest rate as compensation against the risk of inflation eroding the value of the investment.
Credit Quality
The third component is generally not applicable to U.S. Treasuries because it is based on the interest rate the market demands in relation to the issuer’s credit quality. U.S. Treasuries come the closest of any asset to being risk-free due to their backing by the U.S. government, which has never defaulted.
The lower the credit quality of the issuer, the higher the interest rate of the issue should be—again, to compensate investors for the risk that they won’t see their total investment returned via the principal and the coupon payments.
Yield Curve Structure
The normal interest rate structure of U.S. Treasuries produces an upward-sloping yield curve. This is one of three basic shapes the yield curve can take based on the structure of interest rates. The other two shapes are a flat yield curve and an inverted yield curve. The steepness of the slope also varies.
A positive, upward-sloping yield curve is a sign of economic expansion. A negative, inverted yield curve is a harbinger of economic contraction.
The yield curve of U.S. Treasuries is correlated to expectations of economic expansion and contraction because investors adjust their preferences for bond yields based on their sentiment and forecasts.
Though prices of both bonds and stocks reflect investors’ future expectations, stocks are far more volatile and prone to false signals. Stocks have successfully predicted nine of the last five recessions, as economist Paul Samuelson once famously quipped.
The inversion of the yield curve of U.S. Treasuries as first studied by Campbell Harvey, a professor of finance at Duke University and a research associate at the National Bureau of Economic Research (NBER), has accurately indicated a coming recession six out of six times through the 2008 recession.
Because U.S. Treasuries are essentially risk-free, their yield curve reflects their coupon rate and any adjustment for expected inflation that investors demand.
This in combination with the millions of investors that interact with U.S. Treasuries every day—whether it is buying and selling on a daily basis or holding bonds with maturities lasting as long as 30 years—means that the Treasury yield curve tends to accurately reflect investors’ current and future expectations of the economy and inflation.
What Does an Inverted Yield Curve Mean?
An inverted yield curve occurs when shorter-term bills and notes have higher yields than longer-term notes and bonds. Because issues have fixed interest rates, what changes in the yield calculation is the price that investors will buy notes at.
So, when shorter-term yields go up, it means that the prices on these bills and notes have fallen. Concurrently, prices for longer-term dated notes and bonds rise—in this case, reflecting a shift away from stocks to safer investments—pushing their yields lower. The combination of shorter-term yields rising and longer-term yields falling inverts the normally upward-sloping curve.
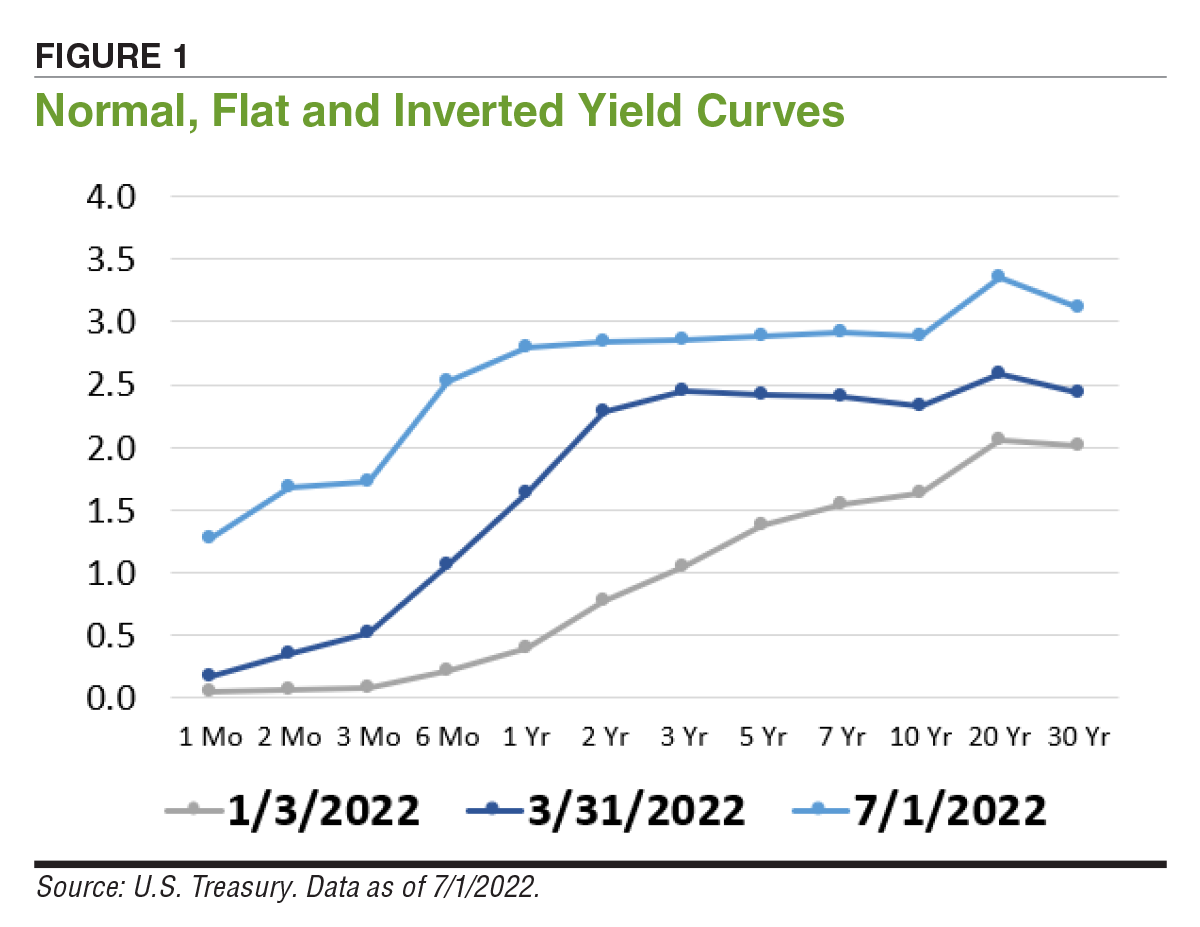
This is what occurred briefly on March 31, 2022. The yield of 10-year U.S. Treasury notes declined below the yield of two-year U.S. Treasury notes (Figure 1).
A variety of situations can cause investor behavior to change and subsequently invert the yield curve.
One such expectation is for interest rates to come down in the foreseeable future, such as when the Fed loosens monetary policy to encourage lending when banks may otherwise be tightening credit standards during slowing economic growth.
In this situation, investors may increase their preference for bonds relative to stocks, and this shift in preference occurs ahead of any actual recession.
Investors also expect the rate of inflation to decrease as demand for goods and services decreases in this situation. If investors perceive that inflation won’t rise as quickly, longer-term bonds become more attractive in that the risk of their coupon payments being eroded by inflation has diminished (but not completely disappeared).
A few other influential factors are international demand for U.S. Treasuries, investors’ appetite for less risky assets and low inflation from benign causes.
As Harvey first hypothesized in the 1980s, an inversion of the yield curve may precede a recession. Reality has borne this out to be accurate so far. However, this doesn’t mean that every inversion of the yield curve signals an impending recession. Harvey recommends that the yield curve should be inverted on average for a quarter or longer to truly indicate a future recession. One or two days of a brief inversion doesn’t cut it.
When looking at the yield curve for March 31, 2022, there was a steep increase in the yield for shorter-term issues but not a steep decrease in the yield for long-term issues. Overall, it displays more of a flattening of the yield curve than an inversion.
The yield curve for July 1, 2022, shows that this is still the situation we are - cautious but not panicking.
The current situation with interest rates is a bit out of the norm since the yield curve briefly inverted despite announced plans for increases in interest rates. But this is due to concerns about inflation being so high and the Fed’s willingness to risk a recession to bring inflation down.
Although the inverted yield curve can anticipate a recession, it does not indicate the length, depth or breadth of a potential recession to come. It also does not indicate a specific timeline for when the recession will start. On average, the time between a notable inversion and the onset of a recession is about one year.
Conclusion
The yield curve of U.S. Treasuries is a beneficial tool for investors in that it may identify major potential changes in the economy ahead of their occurrence, it is free to the public and it is easy to use. A yield curve that is normal and upward-sloping, inverted or flat gives an indication of investor expectations for an expanding, contracting or slowing economy, respectively.
The slope of the curve changes as investor demand changes for Treasuries of different maturities. It sometimes goes against the usual logic that longer-term issues should yield more than shorter-term issues, a normal curve.
When the yield curve flattens or inverts, it may indicate a need to rebalance your portfolio if allocations to riskier assets like stocks are too far above target, or to at least be prepared for a slowing economy, depending on your personal circumstances. Understanding the yield curve helps you to make more certain decisions about the uncertain future.

Related

Related

Stock Strategies
The Yield Curve: A Route to Better Investment Decisions
Discussion
FREE REPORT

Get your free copy of our special
report analyzing the tech stocks
most likely to outperform the
market.
JOHN L from NJ posted over 4 years ago:
You need to log in as a registered AAII user before commenting.
Log InCreate an account